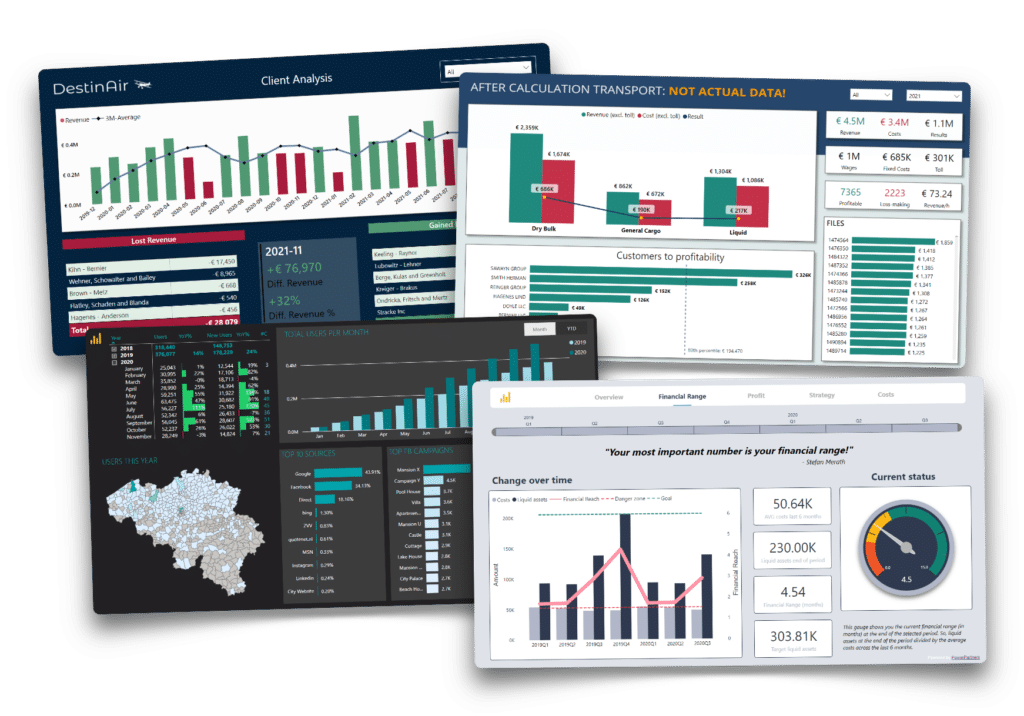
Project management – data analytics in construction industry
Manage your projects like a pro.
__________
BUDGET
22 days, 4 dashboards
DATA SOURCES
Dynamics Business Central, Bouwsoft, Excel
Techbox is a rapidly growing West-Flemish installation company with branches in Kuurne and Bredene that employs more than 120 people. Many projects, many subcontractors, many costs of materials, working hours, private/professional customers… The construction sector lends itself perfectly to business intelligence.
In the dashboard here, fictitious data was used.
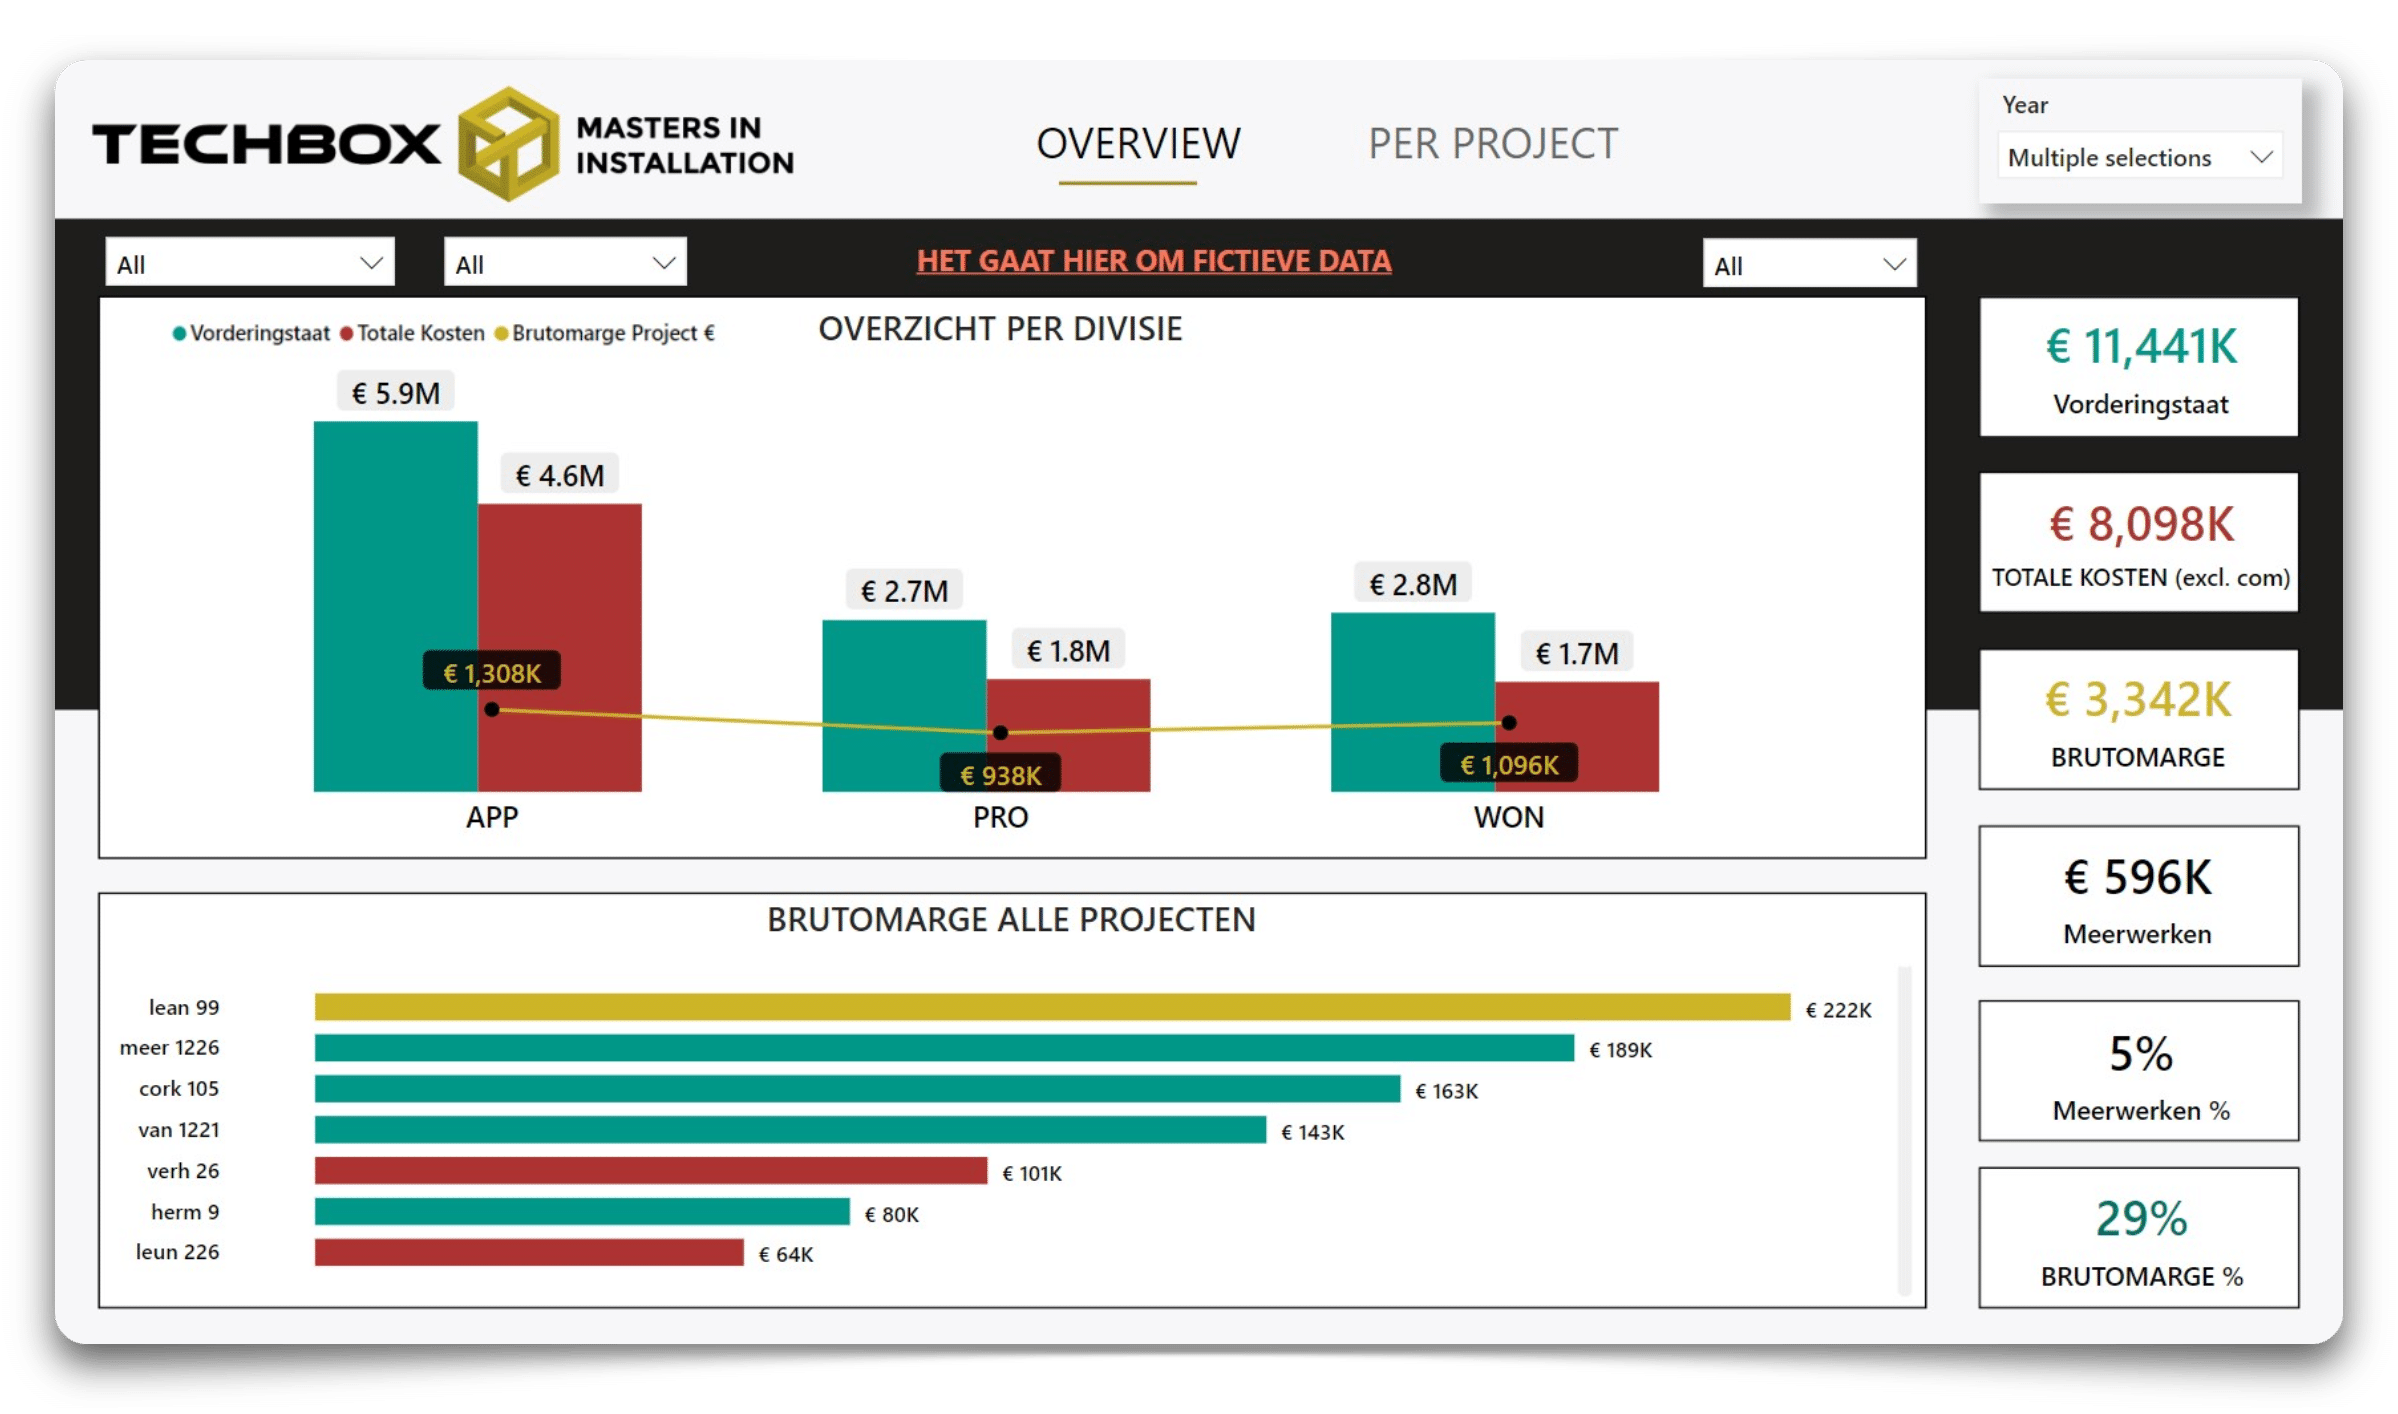
1. Open the dashboard once a week
At the top you select a period to filter the dashboard. On the right, you will immediately see some important parameters. Keep an eye on that gross margin, preferably it does not fluctuate too much. In the middle, you can see the distribution per division as well as the evolution of the gross margin.
At the bottom, a few projects immediately catch the eye. They are arranged according to size and the colours give an indication of the gross margin. The “Leun 226” project achieved a gross margin of €64K, but the gross margin was below the benchmark in percentage terms, which is why the bar is coloured red.
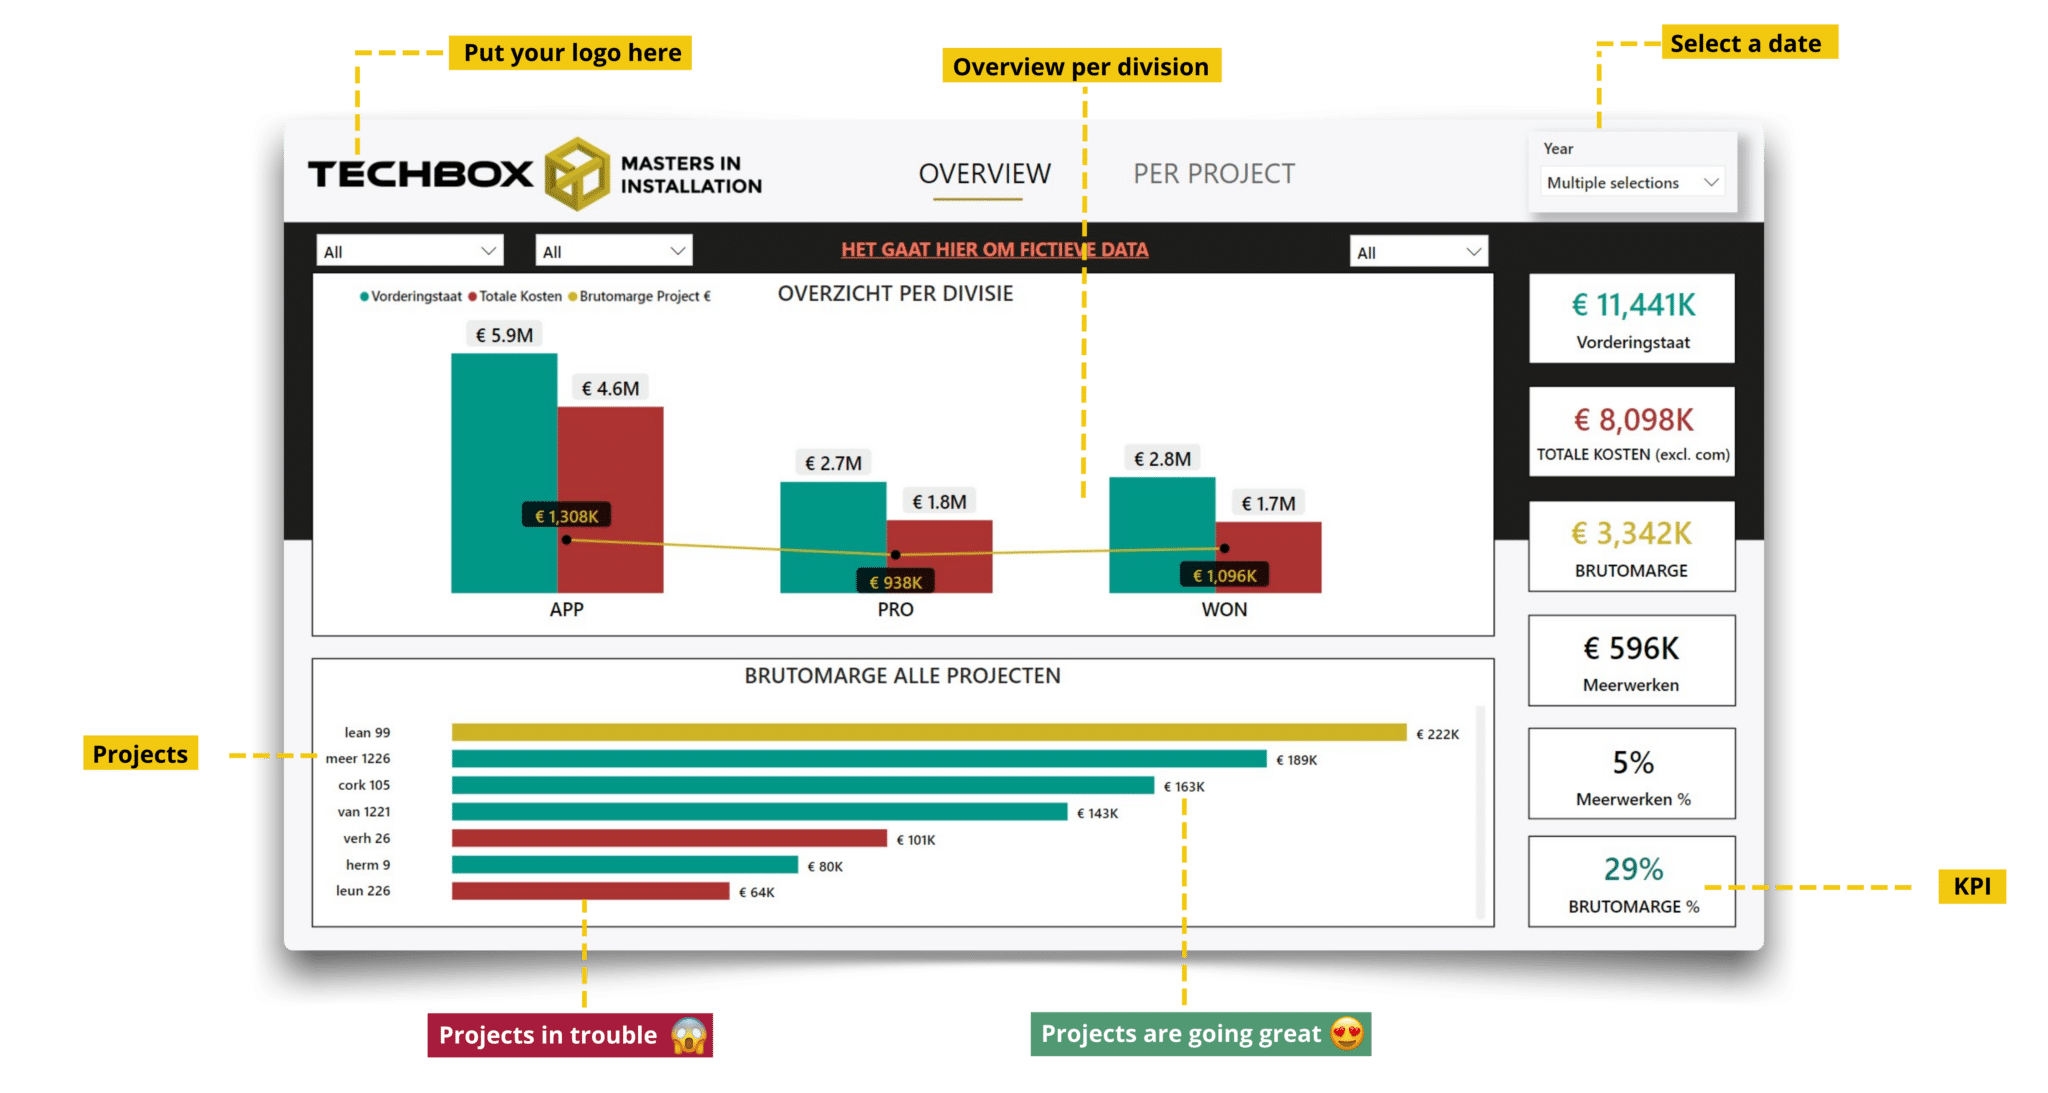
2. Select a project manager and division to filter the dashboard
We would like to analyse in detail the projects of one project manager in one division. The projects of “Marissa Gomez” are mainly in the “Pro” division. She achieved a gross margin of 22% on a turnover of € 366K. Most of her projects meet the KPI benchmark and are therefore green.
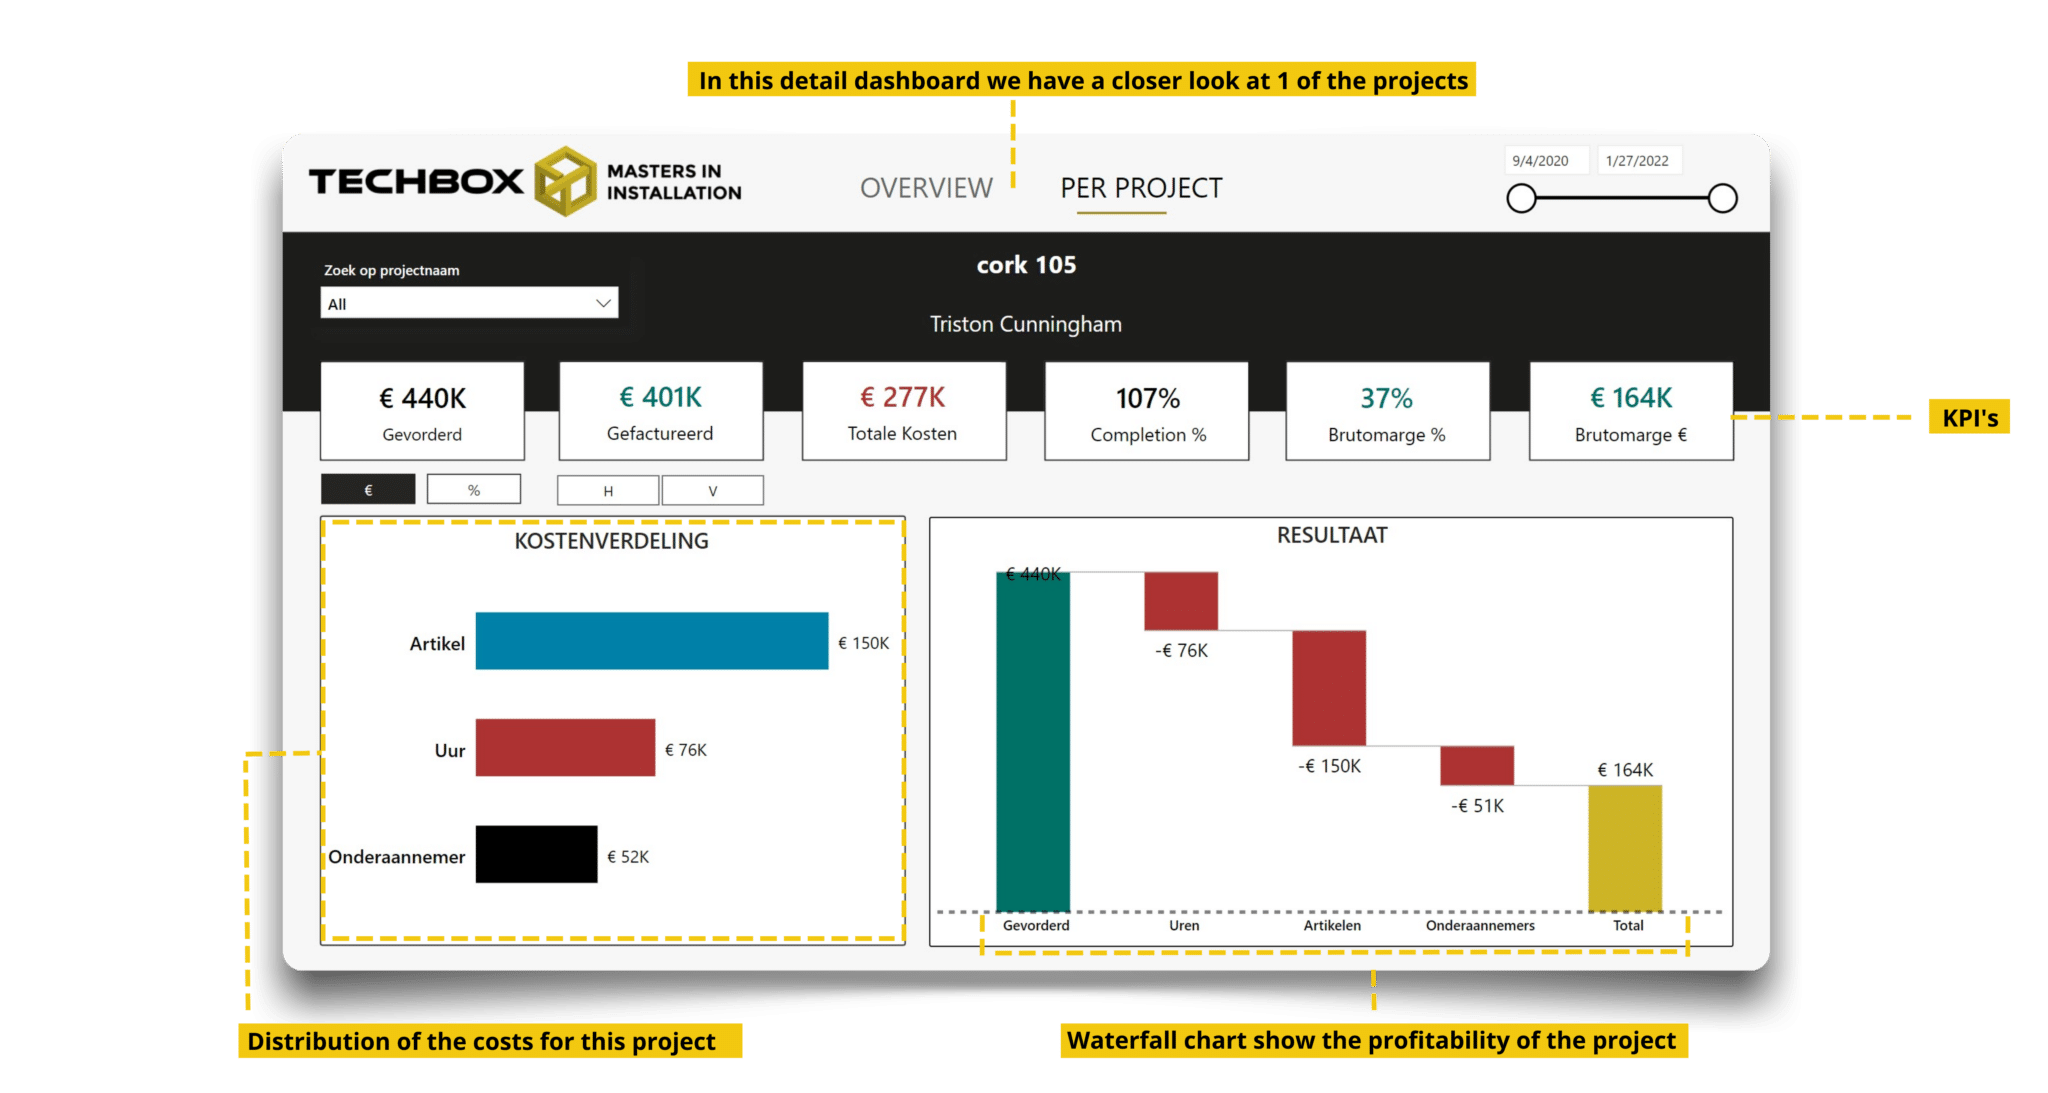
3. Select one project to look at it in detail
Next, we want to look at the evolution of one project in detail. Above, we see the most important parameters of this project. On the bottom left, we follow the cost distribution of this project closely. On the right, we can see exactly how much we have left after deducting all our costs. This project is well managed by the PM and as a manager we can now sleep peacefully again.
Download our dashboard portfolio.
Learn how BI can help your company.
✔ Management dashboards
✔ Financial KPIs
✔ Power BI examples
✔ Free advice