Annual Accounts – time to pause for a second
Is my company still on the right track?
__________

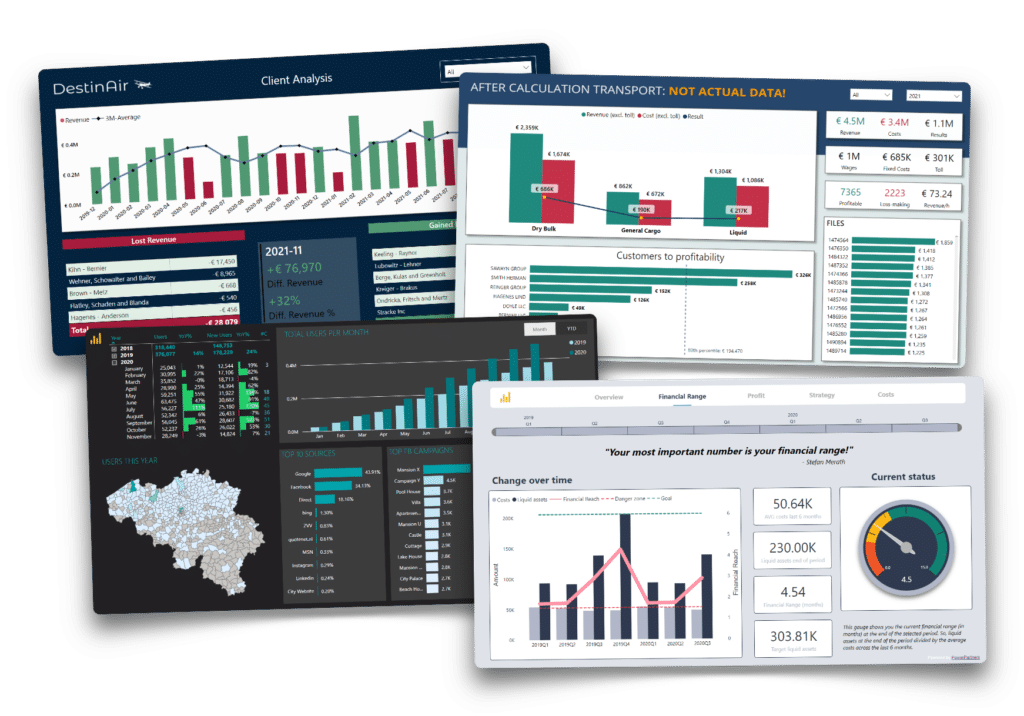
Every Belgian company is obliged to publish its annual accounts. But what can you do with them? All these boring accounting codes hidden in PDF files mean nothing to me. Well, if you dig a little deeper, certain things will emerge. How has your company performed over the past 3-5-10 years?
In this dashboard we use the Deloitte SME Compass and show the most important financial KPIs for SME managers.
1. Open the dashboard once per year
At the top right, select the period to filter the dashboard. On the left side, we see the selection menu. According to the Deloitte report, an entrepreneur works best on 4 aspects: financial structure, profitability, added value and liquidity. Profitability dashboards are really common, and recently we see more and more need for liquidity dashboards.
We start our analysis with the financial structure, where the repayment capacity is very important. We also keep an eye on the structure of the liabilities. On the bottom right, we find some key financial figures for our company.

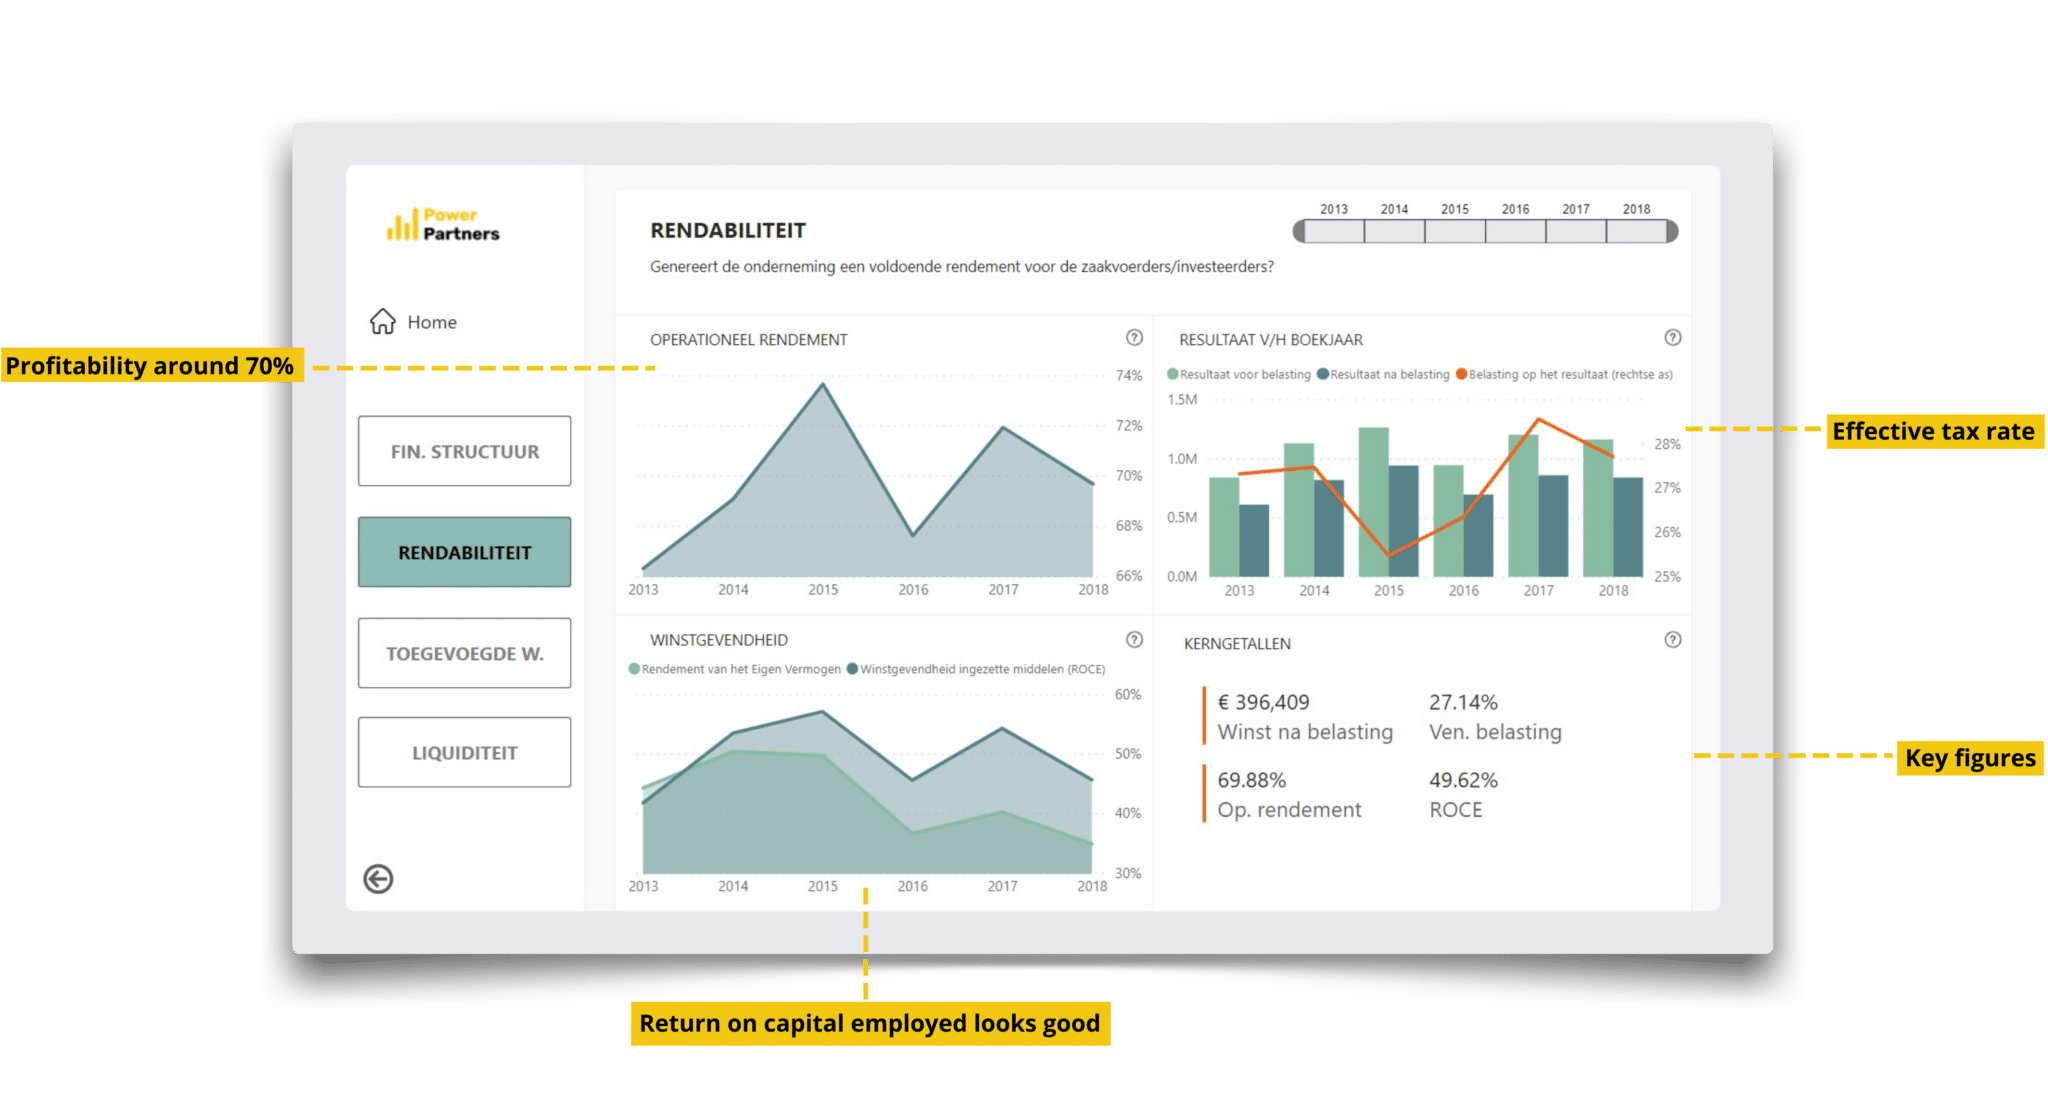
2. Profitability
It is important to keep operating profitability stable; fluctuations create uncertainties and do not provide a climate for investments. On the right-hand side, we monitor the effective taxes. We also distinguish between return on equity and return on capital employed (ROCE).
3. Added value
Are we generating enough operating income with the current wage bill? We use this dashboard to check the labour intensity. On the right-hand side, we see wages as a % of gross margin. In a perfect scenario, this KPI decreases, the labour used is then used more efficiently. At the bottom, we keep an eye on the cost per working hour.

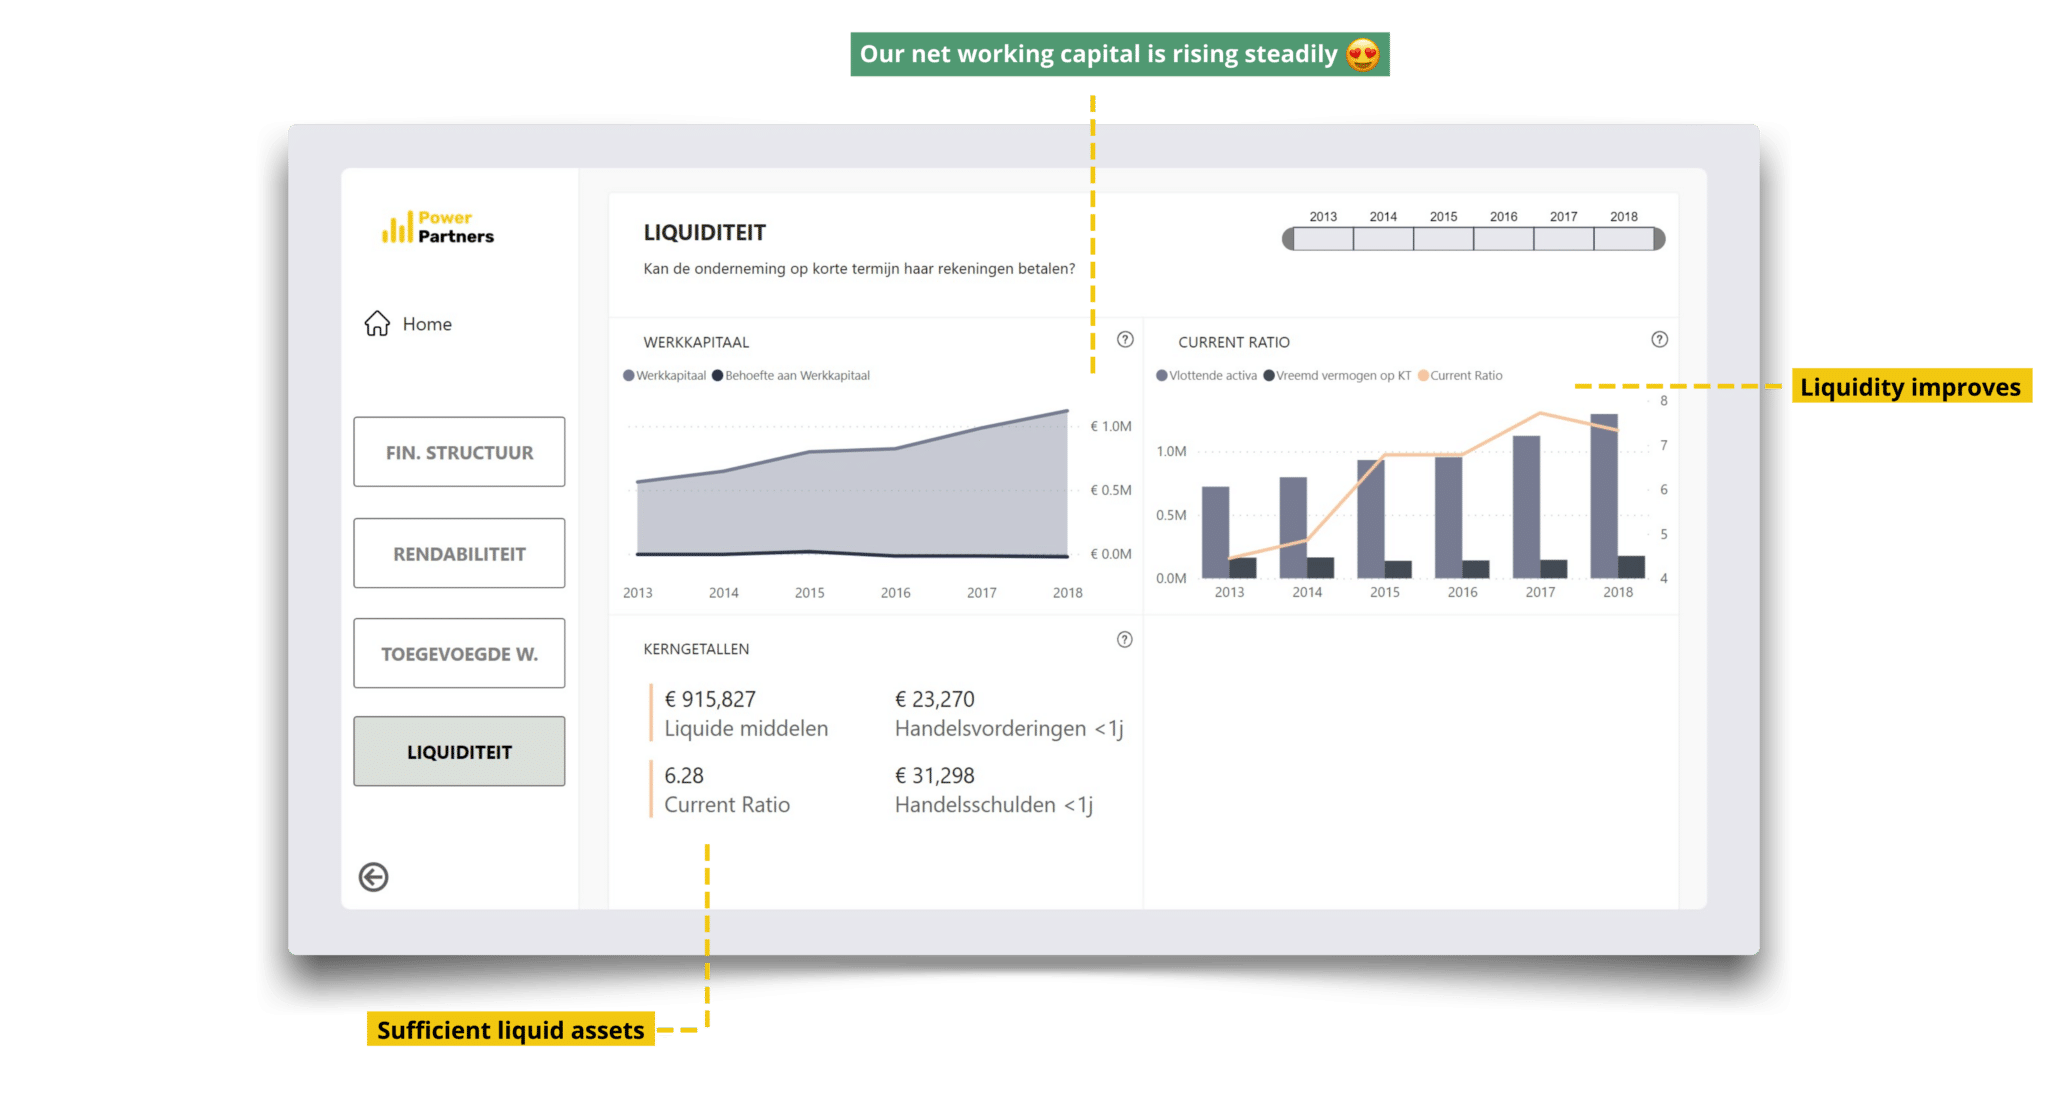
4. Liquidity
Can the company pay all its bills in the short term? In this dashboard, we focus on liquidity, a subject that is reemerging from nowhere. We see here a high level cash overview on an annual level. Due to Corona and inflation issues, we are also building detailed cash flow dashboards again.
Download our dashboard portfolio.
Learn how BI can help your company.
✔ Management dashboards
✔ Financial KPIs
✔ Power BI examples
✔ Free advice