Heinrich Fire Alarm Technology? This sounds like classic craftsmanship. However, if you have the opportunity to visit the business premises near Regensburg, you will quickly find that the Heinrich Fire Alarm Technology is anything but a normal craft enterprise. how? That is what this contribution is about.
- Title: Management Dashboards
- Client: Heinrich Brandmeldetechnik GmbH
- Budget: 15 days (for 6 dashboards)
- Data sources: ES Office, Accounting, Financial Planning (Excel)
Stink normal? But not the Heinrich fire alarm technology!
On the one hand, there are the business premises: Heinrich Brandmeldetechnik is not housed in the anonymous industrial area, but in the old post office in Ponholz, a listed building with its own Wikipedia entry.
On the other hand, of course, there is Alex: the founder and owner of the company with almost ten years of history is anything but a cozy patron. Rather, he puts his company on track for the next step in growth with razor-sharp intellect and rarely seen straightforwardness.
Alexander Heinrich: Success thanks to clarity
Get to know Alexander Heinrich in the following short interview and learn why dashboards and systematic risk management are so important to him with Power BI:
Business Intelligence Dashboards
We were able to build a whole suite of management dashboards for Heinrich Brandmeldetechnik. The data backbone forms how often the ERP system. In this case, it is ES Office, sometimes called ES2000. This merchandise management system, which specializes in installers of security systems, revealed to us - as so often - some unimagined data gold treasures that are not mined in the ERP, which focuses on operational processes.
Profit analysis
Of course, any tax advisor can generate a BWA (profit and loss account) at the touch of a button.
But why do so few entrepreneurs regularly look in there?
Exactly: Numbers are boring. We entrepreneurs are not interested in the details, but in the answers to a few important questions. In relation to profit and loss, these questions are:
- Do I make a profit?
- Will I probably make a profit this year?
- Will I make more profit than I did last year?
3x yes? Bravo, all green. Back to the "right" work.
At least one no? It doesn't help: BWA pulls in and calls the accountant or the tax consultant.
For Heinrich Brandmeldetechnik, we deliberately focused on rough analysis during profit analysis and avoided a common error in dashboard design: the mistake of wanting to squeeze all available data into a dashboard.
Intelligenz gefällig?
Das Dashboard des Monats publiziert einmal pro Monat Business Intelligenz: Innovative Dashboards, Hintergrundinformationen zu KPIs, Management und Methoden. No Bullshit, no Spam. Unternehmerehrenwort. Jetzt registrieren!
Customer analysis
A company like Heinrich Brandmeldetechnik naturally has many returning customers. No wonder Alexander Heinrich wants to consistently focus on long-term, deep customer relationships. To this end, it is important for him to analyse the development of customers according to the following dimensions:
- Time: Which customers are making more and more sales? Which less and less?
- Customer group: Do my A-customers love me just like I do?
- Order type: Are the inspections the sales drivers, or rather the projects?
We took the trouble to completely anonymize this dashboard and make it available as an interactive dashboard here. Try it! The operation is (almost) self-explanatory, and clicking rum alone shows how helpful it is that in Power BI the various visual components are linked and can be used as mutual filters.
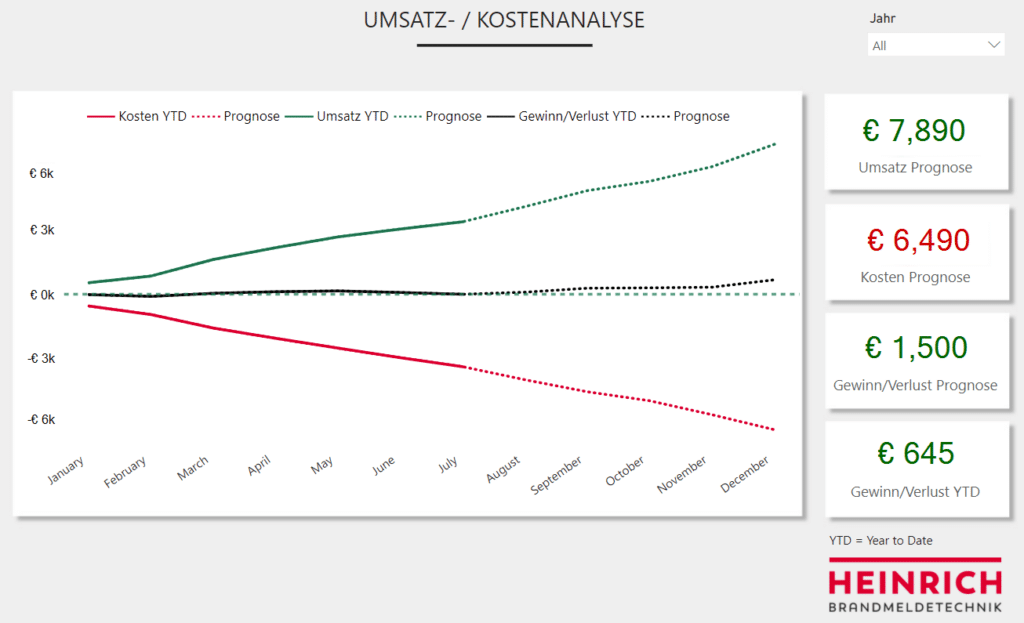
Cost analysis
Sooner or later, every entrepreneur learns - sometimes on the hard way - that we are always at the mercy of short-term sales fluctuations. That is why we are all building up a nice financial reach. And that's why it's so important to keep costs under control at all times and to detect wrong developments early on.
how?
With a dashboard, of course.
In this dashboard, too, we have built on our proven design:
- Header with filter
- at the top left the development over the time dimension
- a discriminator at the top right - in this case, the cost type
- Below is the detailed analysis for the selected filters
The detailed analysis manages to combine actual state and development in absolute numbers and percentages in a single visualization. This not only looks fancy, but is also enormously useful in detailed analysis.

Lust auf mehr?
Kontaktieren Sie uns unverbindlich per Telefon (+41 44 500 60 30) oder über dieses Formular, falls Sie mehr über Power Partners, Power BI oder das Dashboard of the Month wissen möchten.
Geo-location for the entire workforce
The use of online maps and geolocation data is becoming more and more popular, as we can determine from our customer enquiries. But also for us the use in connection with a mobile application on the smartphone was a special challenge. This is not a classic BI application. In addition, the small screen makes a special requirement for design and user experience (UX).
The goal is to provide the service technicians with a tool that allows independent decision-making and action while at the same time minimizing the administrative burden in the offices of Heinrich Brandmeldetechnik.
The idea is simple: if a fitter has finished his assignment earlier than planned, he will look on his smartphone to see where maintenance is still pending in his surroundings.

A particular challenge was that the data must be up-to-date at all times. Unlike traditional BI applications, where daily or weekly figures are often sufficient, a service technician naturally wants to know exactly whether the planned inspection has not actually been carried out. We ensured this with a so-called Direct Query, which maintains a live connection between the mobile phone and the ERP database via the Power BI Gateway.
Success-Screen: Power BI on the Smart TV
With Power BI, it's always the same: Once the data is processed in a clean analytical data model, the ideas start to bubble. Luckily, if the data is properly processed and we know it, the creation of a dashboard is done quite quickly. So we had no problem to offer the following cool idea of Alexander Heinrich as a small goodie: A map, designed for a screen in the office of Heinrich Brandmeldetechnik. The projects are visualized, the success is made tangible. Let's conquer Bavaria!
Technically, the setup with smart TV is a bit tricky. On the one hand, a protected connection must be established, because you do not want to make the dashboard publicly visible. On the other hand, it must be ensured that the dashboard updates itself (i.e. without user interaction). Both, however, are relatively easy to do once you have the spin out.
And so I like to imagine how the assembled Heinrich team gathers every morning in front of the screen in the reception room of the old post office, throws up a clenched fist and shouts in the choir: "We are here in our territory! Out of the way, now we're coming!"

Social Media Marketing Dashboard in Power BI
And Power Partners is already working on the next project with Heinrich Brand Meldetechnik. An integral social media marketing dashboard is planned, which will ensure the success of marketing campaigns and can measure and compare the success of different channels. For example, campaigns on Facebook, Google Adwords, Bing Ads, and Mailchimp are merged and compared in an integrative dashboard. Who knows, maybe there will be a "Dashboard of the Month" on this topic at a later date?
Customers make us strong!
We are incredibly grateful to have customers like Alexander Heinrich: customers who know exactly what they want. Customers who think strategically. And last but not least, customers who demand us with their ideas and do not let us go until we have made the impossible possible. Because it is precisely this mindset that brings us forward, makes us stronger and better. Thank you, Alex!


