What investment should we provide for such a project? A common question when we talk to companies. Unfortunately, there is no one-size-fits-all answer. Fortunately, we at Power Partners have developed some mechanisms to determine the price of a business intelligence project, we are happy to share these with you. At the end of this article we will send you to our own developed price calculator. In just 5 steps you can calculate the cost for your own dream dashboard(s). All our projects are always carried out at a predetermined price (working days), so you will never be faced with surprises.
Steps in the BI process
An example
Let's bring in a fictional example to make it all a little more vivid. You are an entrepreneur of a beautiful flourishing SME. The following characteristics describe you.
- Employees: 50-250
- Business activity with a lot of data/transactions
e.g. transport, construction, webshop, manufacturing... - The company consists of several departments/business units:
e.g. finance, sales, marketing, planning, hr... - As an entrepreneur you would like to improve various KPIs
e.g. profitability, customer conversion, stock rotation...
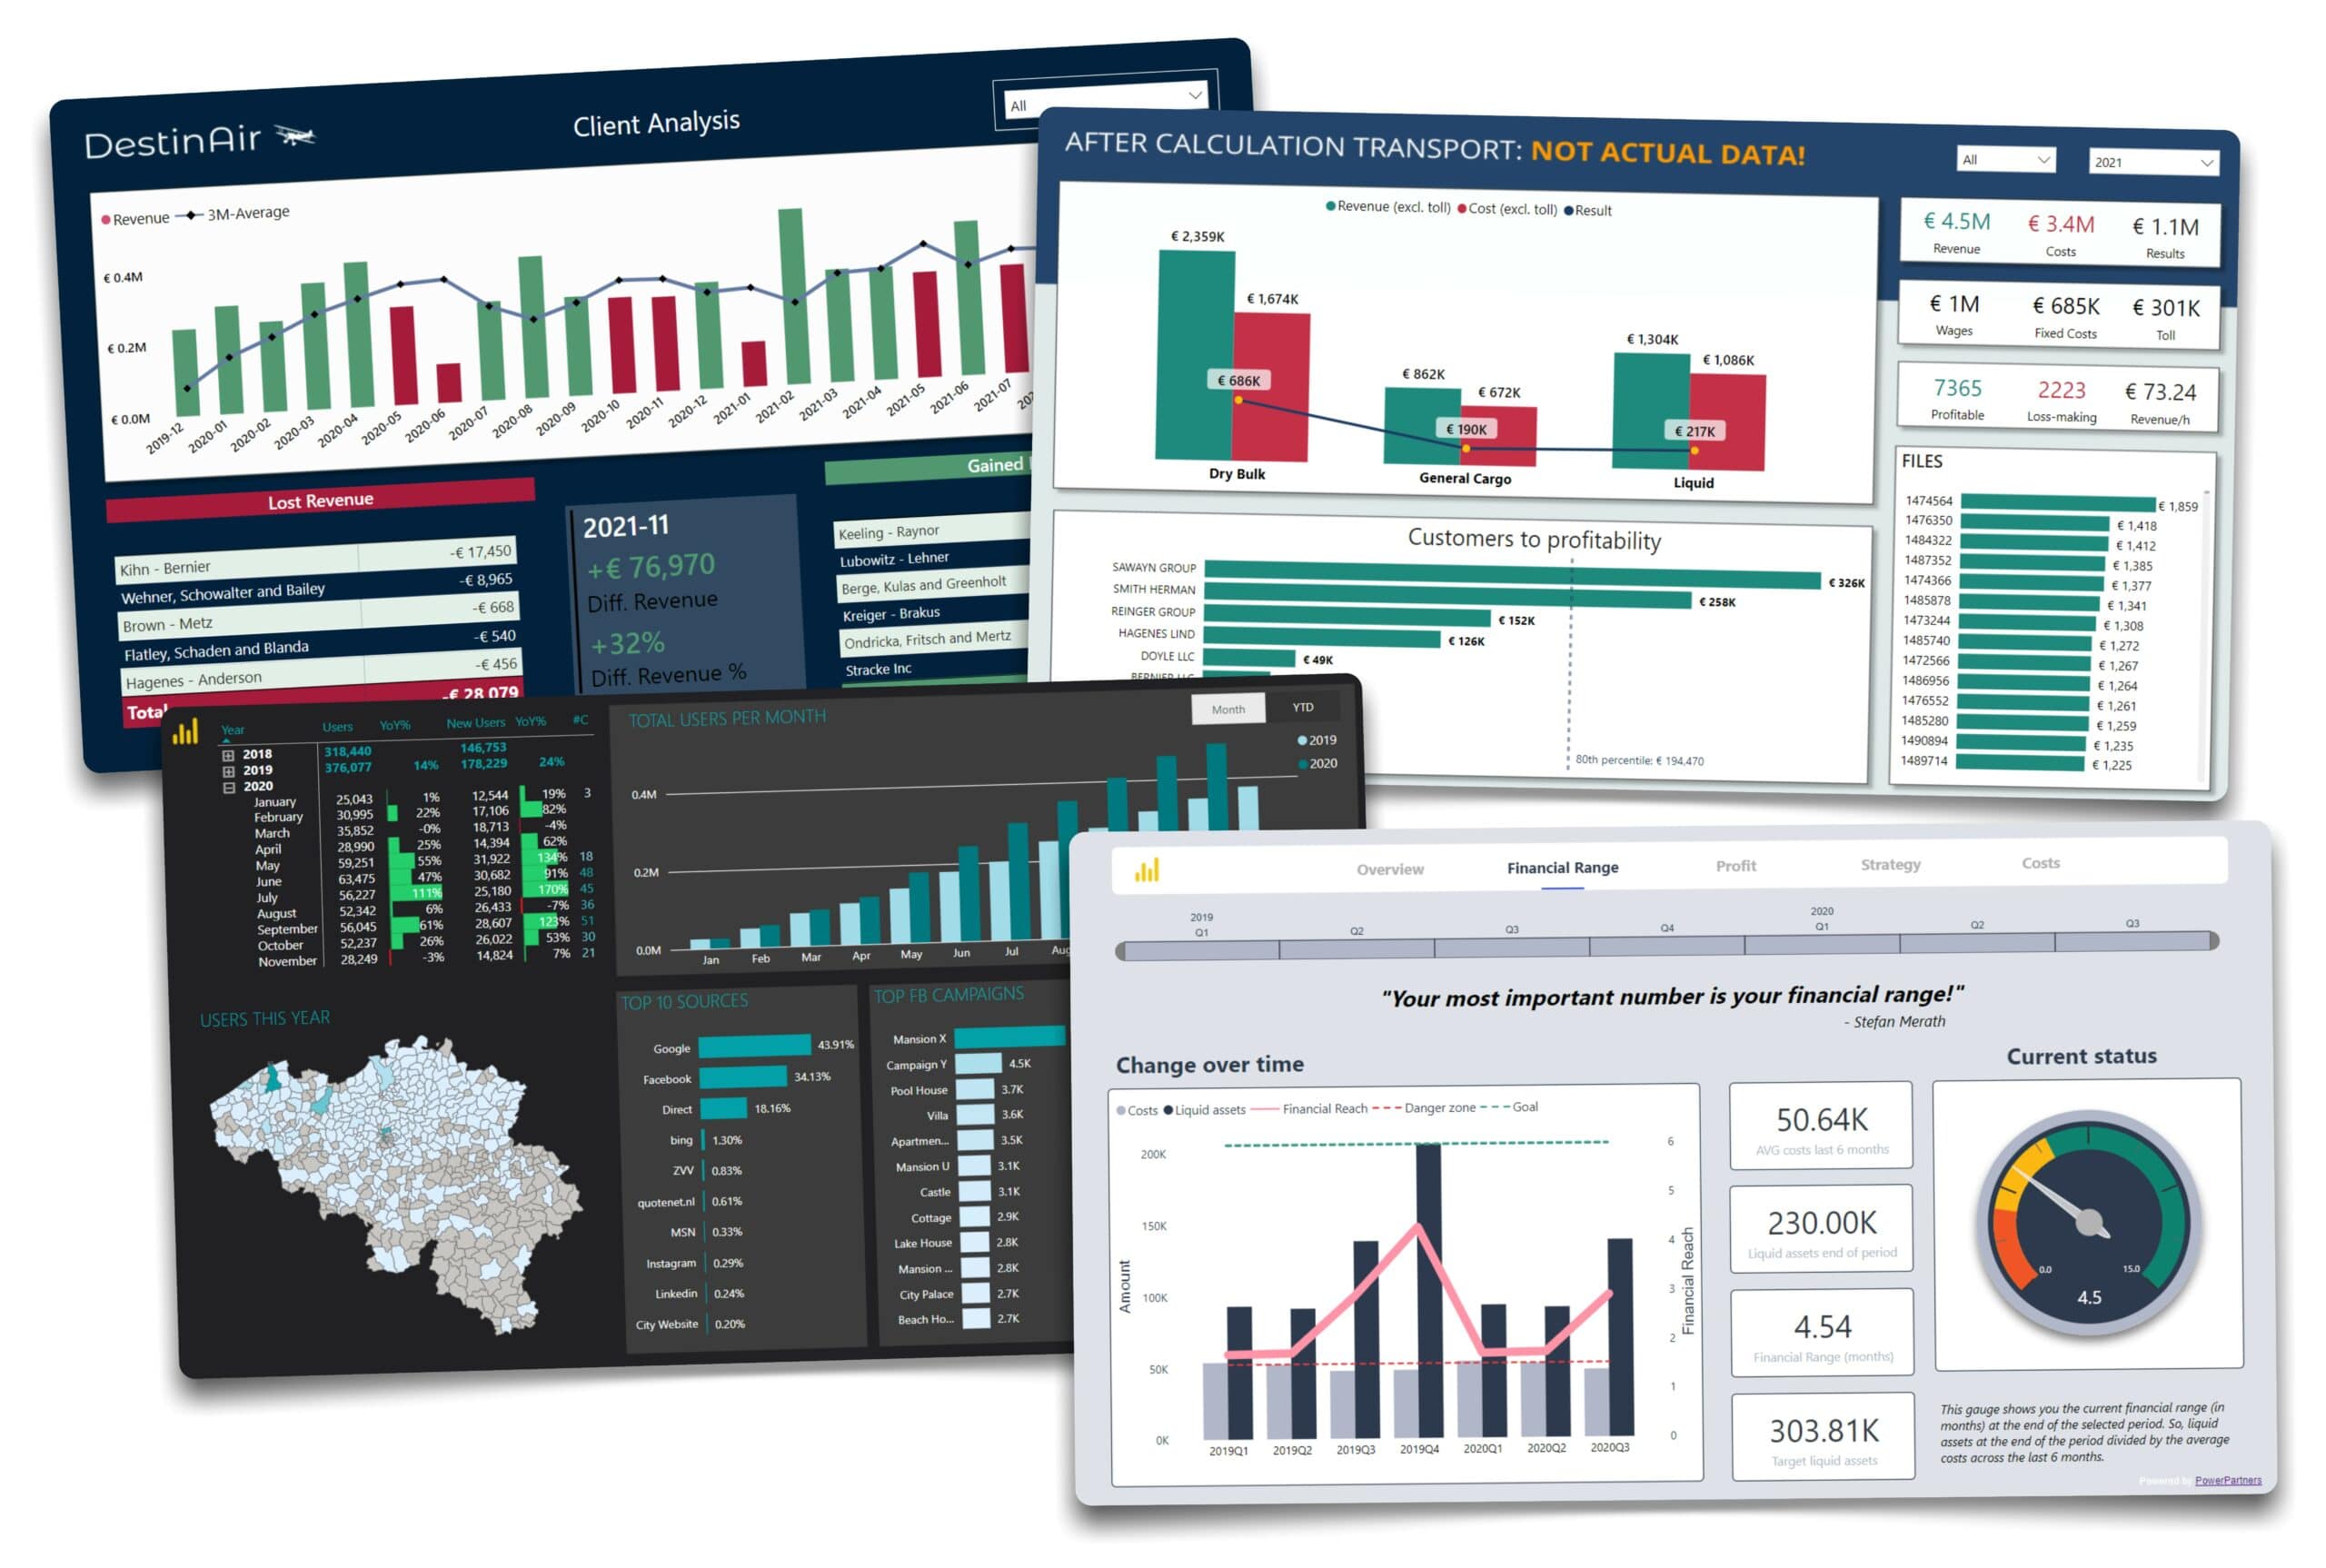
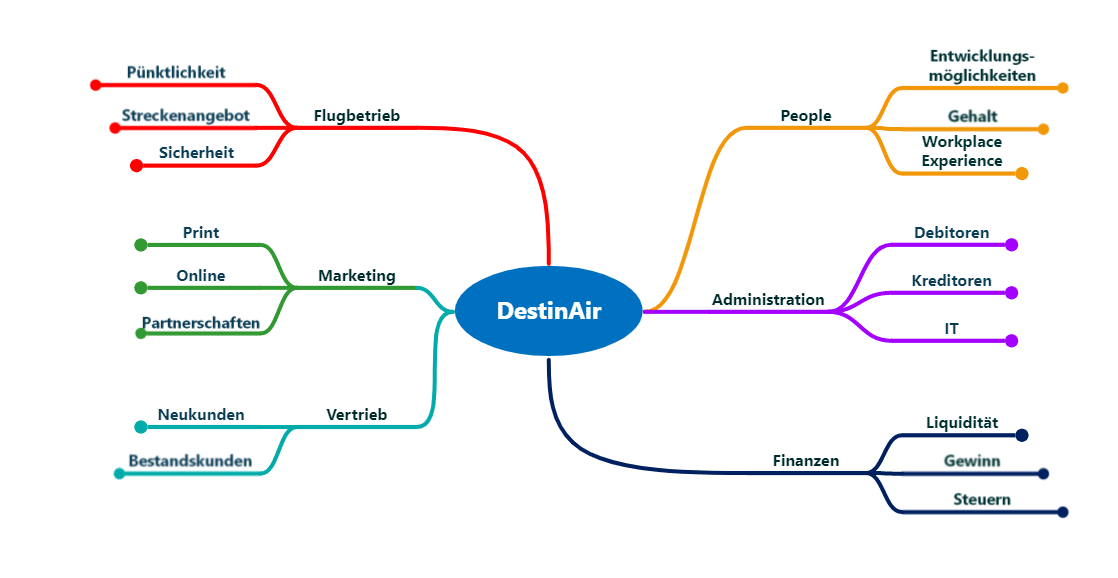
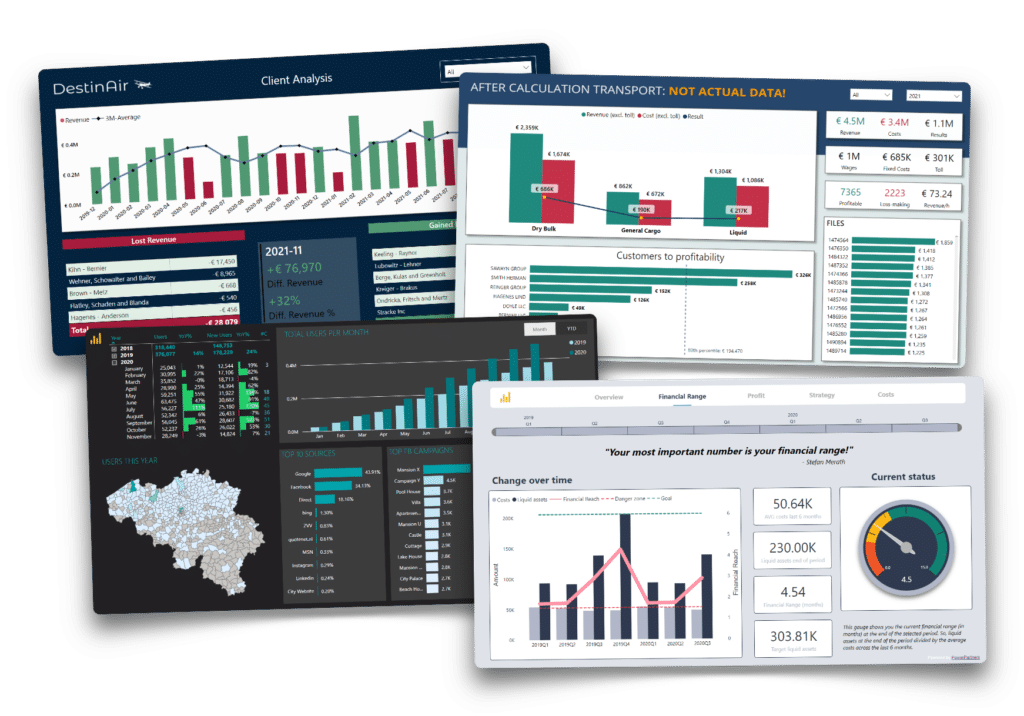
Below is a landscape/orgchart of our fictitious company, "DestinAir". This is a small airline, you could compare it to Wright Air Service. We would like to start with the analysis of 4 KPIs on 3 different domains of the company. For this we will develop 1 dataset with multiple dashboards. We will have 1 dashboard as an overview with the current state of all KPIs. We will then build one detailed dashboard per KPI. This helps us to better map the evolution of the KPI and its components. In total, we want to develop 5 dashboards.
Later on, we want a dashboard for each business unit. But as with all IT projects, it is better to start with a solid foundation. This is exactly why we start every project with one consulting day (€ 1490) on site. Would you like to know what process we follow in such a day? Find out in our services section. In this example, we assume that the consulting day is already behind us and therefore all the necessary information is available.
Cost drivers
A) Data sources
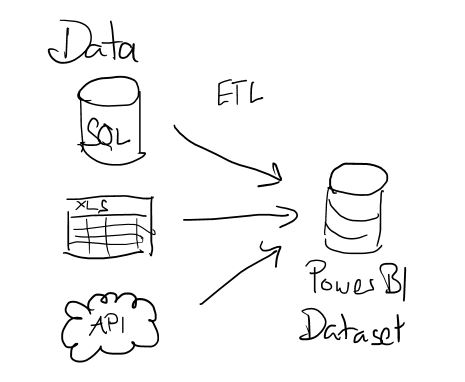
One of the most important cost drivers is the data sources. How many systems do you use within the company and where is the data stored? You probably have an ERP (SAP, Odoo, Dynamics...), often also an accounting program (Exact, Yuki, Sage...). Maybe you also have data from your website, some Excel files and possibly also specific software tailored to the sector (planning, warehouse ...).
The power of Power BI is to bring all this data together in one data model. In order to extract this data from these different systems in a structured manner, a connection must be made to each system.
This connection is usually done via an API connection. Our data engineers write code (python) to automatically "pull" all the necessary data into Power BI at the appropriate time.
Building these connections is one of the most important drivers of the working hours and therefore also of the cost. Fortunately, we are very specialized in this and we can connect any data source in 2-3 working days.
So for our example, this means.
- ERP system: 2 days
- Accounting system: 2 days
- Google Analytics: 1 day
- Excel: 1 day
-> Intermediate total: 6 days
B) The data model
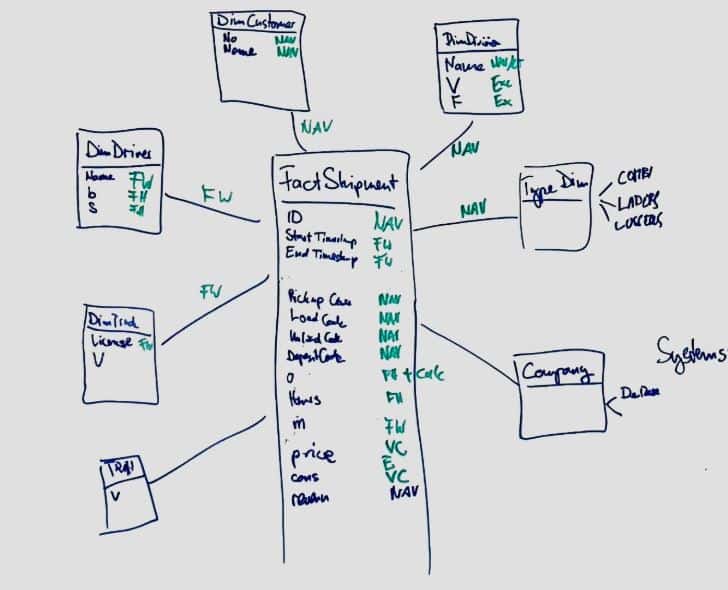
Once we have extracted the data from the various systems in a structured manner, we build a data model. A lot of thinking precedes this. We also spend a significant amount of time on this topic during our consulting day. The quality of the data model will later determine how intuitively we can build powerful dashboards.
The data model often has multiple versions and is created through an iterative process until the appropriate setup is found. This is the work of our data architect. He/she will usually calculate 2-3 days for this.
-> Intermediate total: 8 days
Not yet subscribed?
Have you already subscribed to our monthly newsletter, Dashboard of the Month? Month after month, we present a dashboard and share insight on how our customers design smart KPIs, how they set their goals, and how they make sure they reach them by tracking progress in a Power BI dashboard. Not to miss!
C) The dashboards
Once the data model has been developed and implemented, the data architect passes on the project to the data analyst. The model already contains the data from all the different sources. The right relationships have already been established. What follows is a brainstorming session of the data analyst. He/she will now design the dashboards to best meet the needs of the end users. Some important tasks here are.
- Determining the layout and design
- Choosing the appropriate graphs
- Developing the right measures
- Implementing the necessary filters
- Interactions between the visual components
- Checking the correctness of the data
All our Power BI dashboards are always fully customized. Filters, interactions, graphs, buttons... are discussed in detail with the end users.
We develop a simple and clear background with your logo and company colors. Throughout the dashboards, the corporate identity comes back again and again. It is important that the colors and background strengthen the visualizations, but do not dominate. In concrete terms, this means that we start each project with a sketch on a white paper and evolve into a fully operational dashboard via multiple feedback meetings.

Surely all that customization must cost a lot?
Well, that's not so bad. Power BI is quite intuitive and our data analysts make it their mission to always be up to date with the latest features and updates.
You have to count on 1-2 working days per dashboard to go from a sketch on paper to a fully interactive dashboard. In our example, we would like 1 overview dashboard and 4 detail dashboards.
- KPI overview: 1 day
- Detail financial: 1 day
- Detail marketing: 1 day
- Detail operational: 1 day
- Detail HR: 1 day
-> Intermediate total: 13 days
D) Extras
If necessary, we can now refine the dashboards and the dataset even further tailored to the company's needs. For example, we can build in additional security mechanisms where certain users can only see their own data. While the department head can only view the data of his / her team. The management team has access to the complete data. Power BI allows you to arrange all this via a unique user login and Row Level Security (RLS). For example, everyone looks at the same dashboard, but each individual only sees the data that is accessible to him / her.
For such extra security you have to count on +1 day
Mobile version of the dashboard on your smartphone. Power BI also has an app that you can easily download for iOS or Android. Just log in with your Power BI account and you will be able to consult all the dashboards on your smartphone. Sometimes dashboards need to be specially developed for the smartphone.
You can try this out yourself or we are happy to help you on your way. +1 day
Result
The request here consists of: 5 dashboards with multiple KPIs built on 4 different data sources. As an extra we would like RLS (Row Level Security) and a mobile version of the dashboard for your smartphone.
| 4 data sources (ERP, accounting, website, Excel) | 6 days |
| 1 data model | 2 days |
| 5 dashboards | 5 days |
| Row level security | 1 day |
| Mobile app | 1 day |
| Total price | 15 days * € 990 = € 14'850 |
Do the calculation yourself
In just 5 steps you can calculate the cost of your dream dashboard(s). We use exactly the same formulas as mentioned above. Take the test yourself now!
Download our
dashboard portfolio.
Learn how BI can help your company.
✔ Management dashboards
✔ Financial KPIs
✔ Power BI examples
✔ Free advice

