How this dashboard can help you as a business owner to stay ahead of liquidity risks in times of Coronavirus.
LIQUIDITY CRISIS
In Switzerland the Federal council announced their new stimulus program last week to help small and medium-sized enterprises (SMEs). These companies can now take on a bridge loan with a 100% federal government guarantee and a 0.00% (!) interest rate for amounts of up to CHF 0.5 million repayable in 5 years. The state-backed loans became available on Thursday. By midday, Credit Suisse already received 2,700 applications and had paid out half a billion francs. UBS said it had 3,000 applications.
In France, Finance Minister Bruno Le Maire said that the government will mobilize 45 billion euro as a first immediate economic assistance to companies. Le Maire also told French RTL radio, “We don’t want bankruptcies.” Meanwhile Germany’s Minister of Economy, Peter Altmaier said, “Make no mistake, we’re determined to protect our companies and jobs.” After announcing another 50 billion euro program to help small businesses and the self-employed threatened with bankruptcy by the corona virus crisis (link).
All across Europe, businesses are struggling to keep up their operations, and governments have to intervene with unprecedented measures to provide liquidity to the economy.
Never let a good crisis go to waste.
- Winston Churchill
BE PREPARED
According to a study published in 2016 by JP Morgan, the median SME holds 27 days of cash buffer.
Many small businesses may not have enough cash to continue operations in the face of a month-long loss of cash inflows due to an economic downturn or other negative shock.
And that’s exactly what’s happening today.
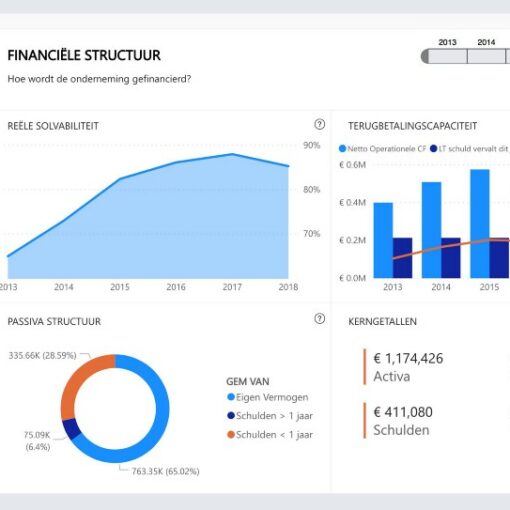
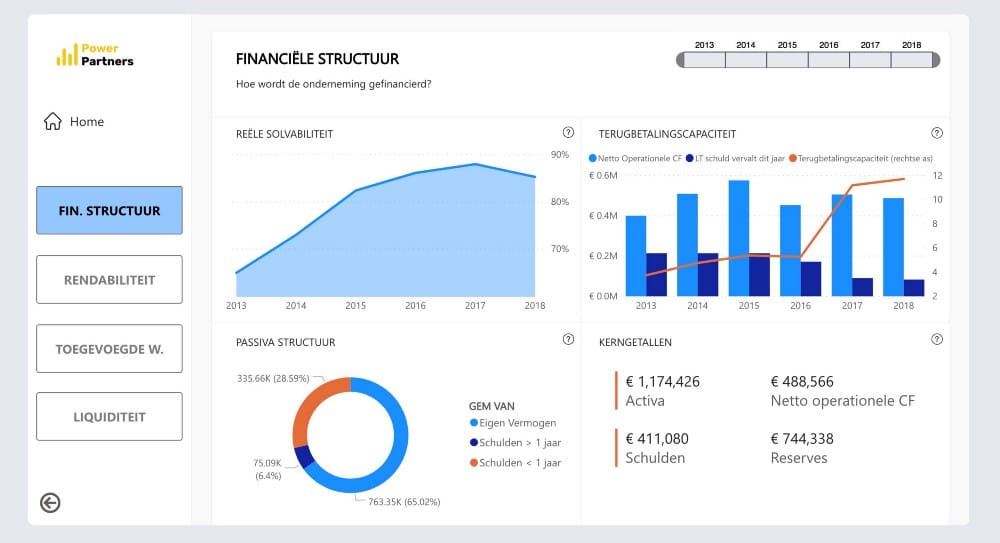
Over the past year here at ipub GmbH, we have been using a financial dashboard to keep track of our key liquidity indicators. We’ve built the dashboard in-house, using Microsoft Power BI. Every month we store our new financial statement in a sharepoint folder and the dashboard gets updated automatically. This means all data is up to date and the reports are interactive. We think that’s the beauty of this dashboard. On top of that we’ve set an email alert on our key KPIs, so whenever a goal is reached, management receives an email update.
Lust auf mehr?
Contact us by phone (+41 44 500 60 30), by mail [email protected] or with this form to learn more about Power Partners, this dashboard or Power BI.
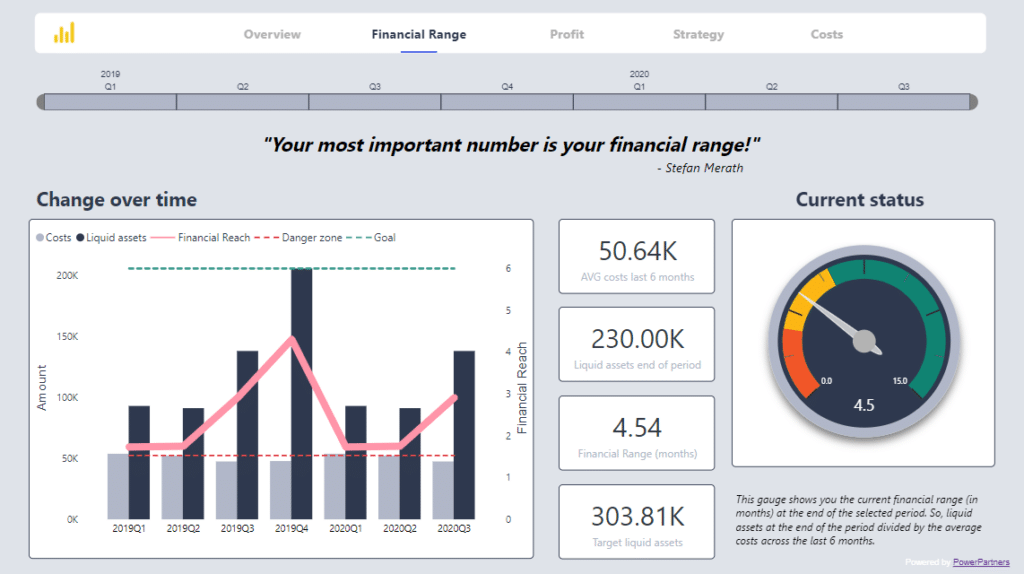
FINANCIAL RANGE
The key component in this dashboard is the financial range of the company. Initially described by Stefan Merath in his finance e-book. For the German speakers, go read the document, it’s good. I will explain it here in short. In essence the financial range answers the question: if your revenue drops to 0 tomorrow, how long can your business survive?
Financial Range = Average fixed cost / Liquid assets
The financial range relates to your profit just like breathing relates to eating. You can go sometime without making any profit, however, if your financial range is 0 days, you are cut off from air and you die even if you are otherwise profitable. Your goal should be to have a financial range of at least 6 months (see gauge). This dashboard (5 reports, link below) will show your current financial range, and it indicates the required costs savings in order to reach the 6 month goal. Reaching this goal will help you have a good night’s sleep in times like these. 🙂
If your revenue drops to 0 tomorrow, how long can your business survive?


