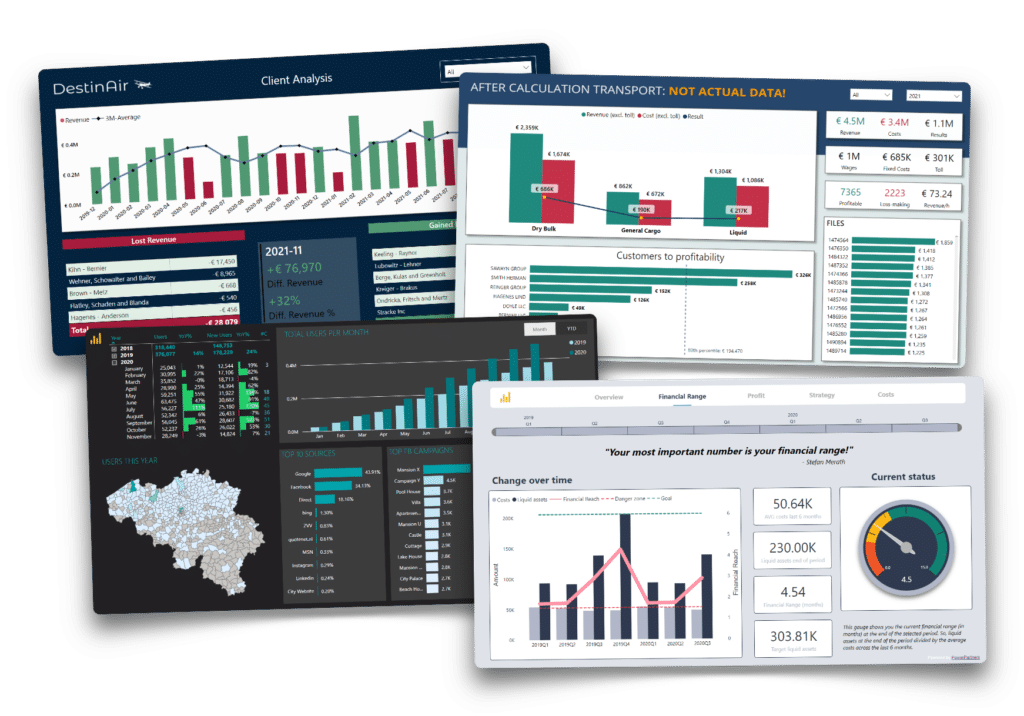
Smart Cargo – Transport & Logistics
Insights in your shipments like you’ve never seen before.
__________
BUDGET
9 days, 2 dashboards
DATA SOURCES
Navitrans, Trimble, VolvoConnect, Excel
Business Intelligence thrives when it can combine data from multiple systems. All the more so when these systems provide large amounts of data. For this reason, BI is a perfect match with the transport and logistics sector.
Read how the management of Transport De Rese can now analyse every delivery, customer or driver to an unprecedented level of detail.
Fake data was used in the article below.
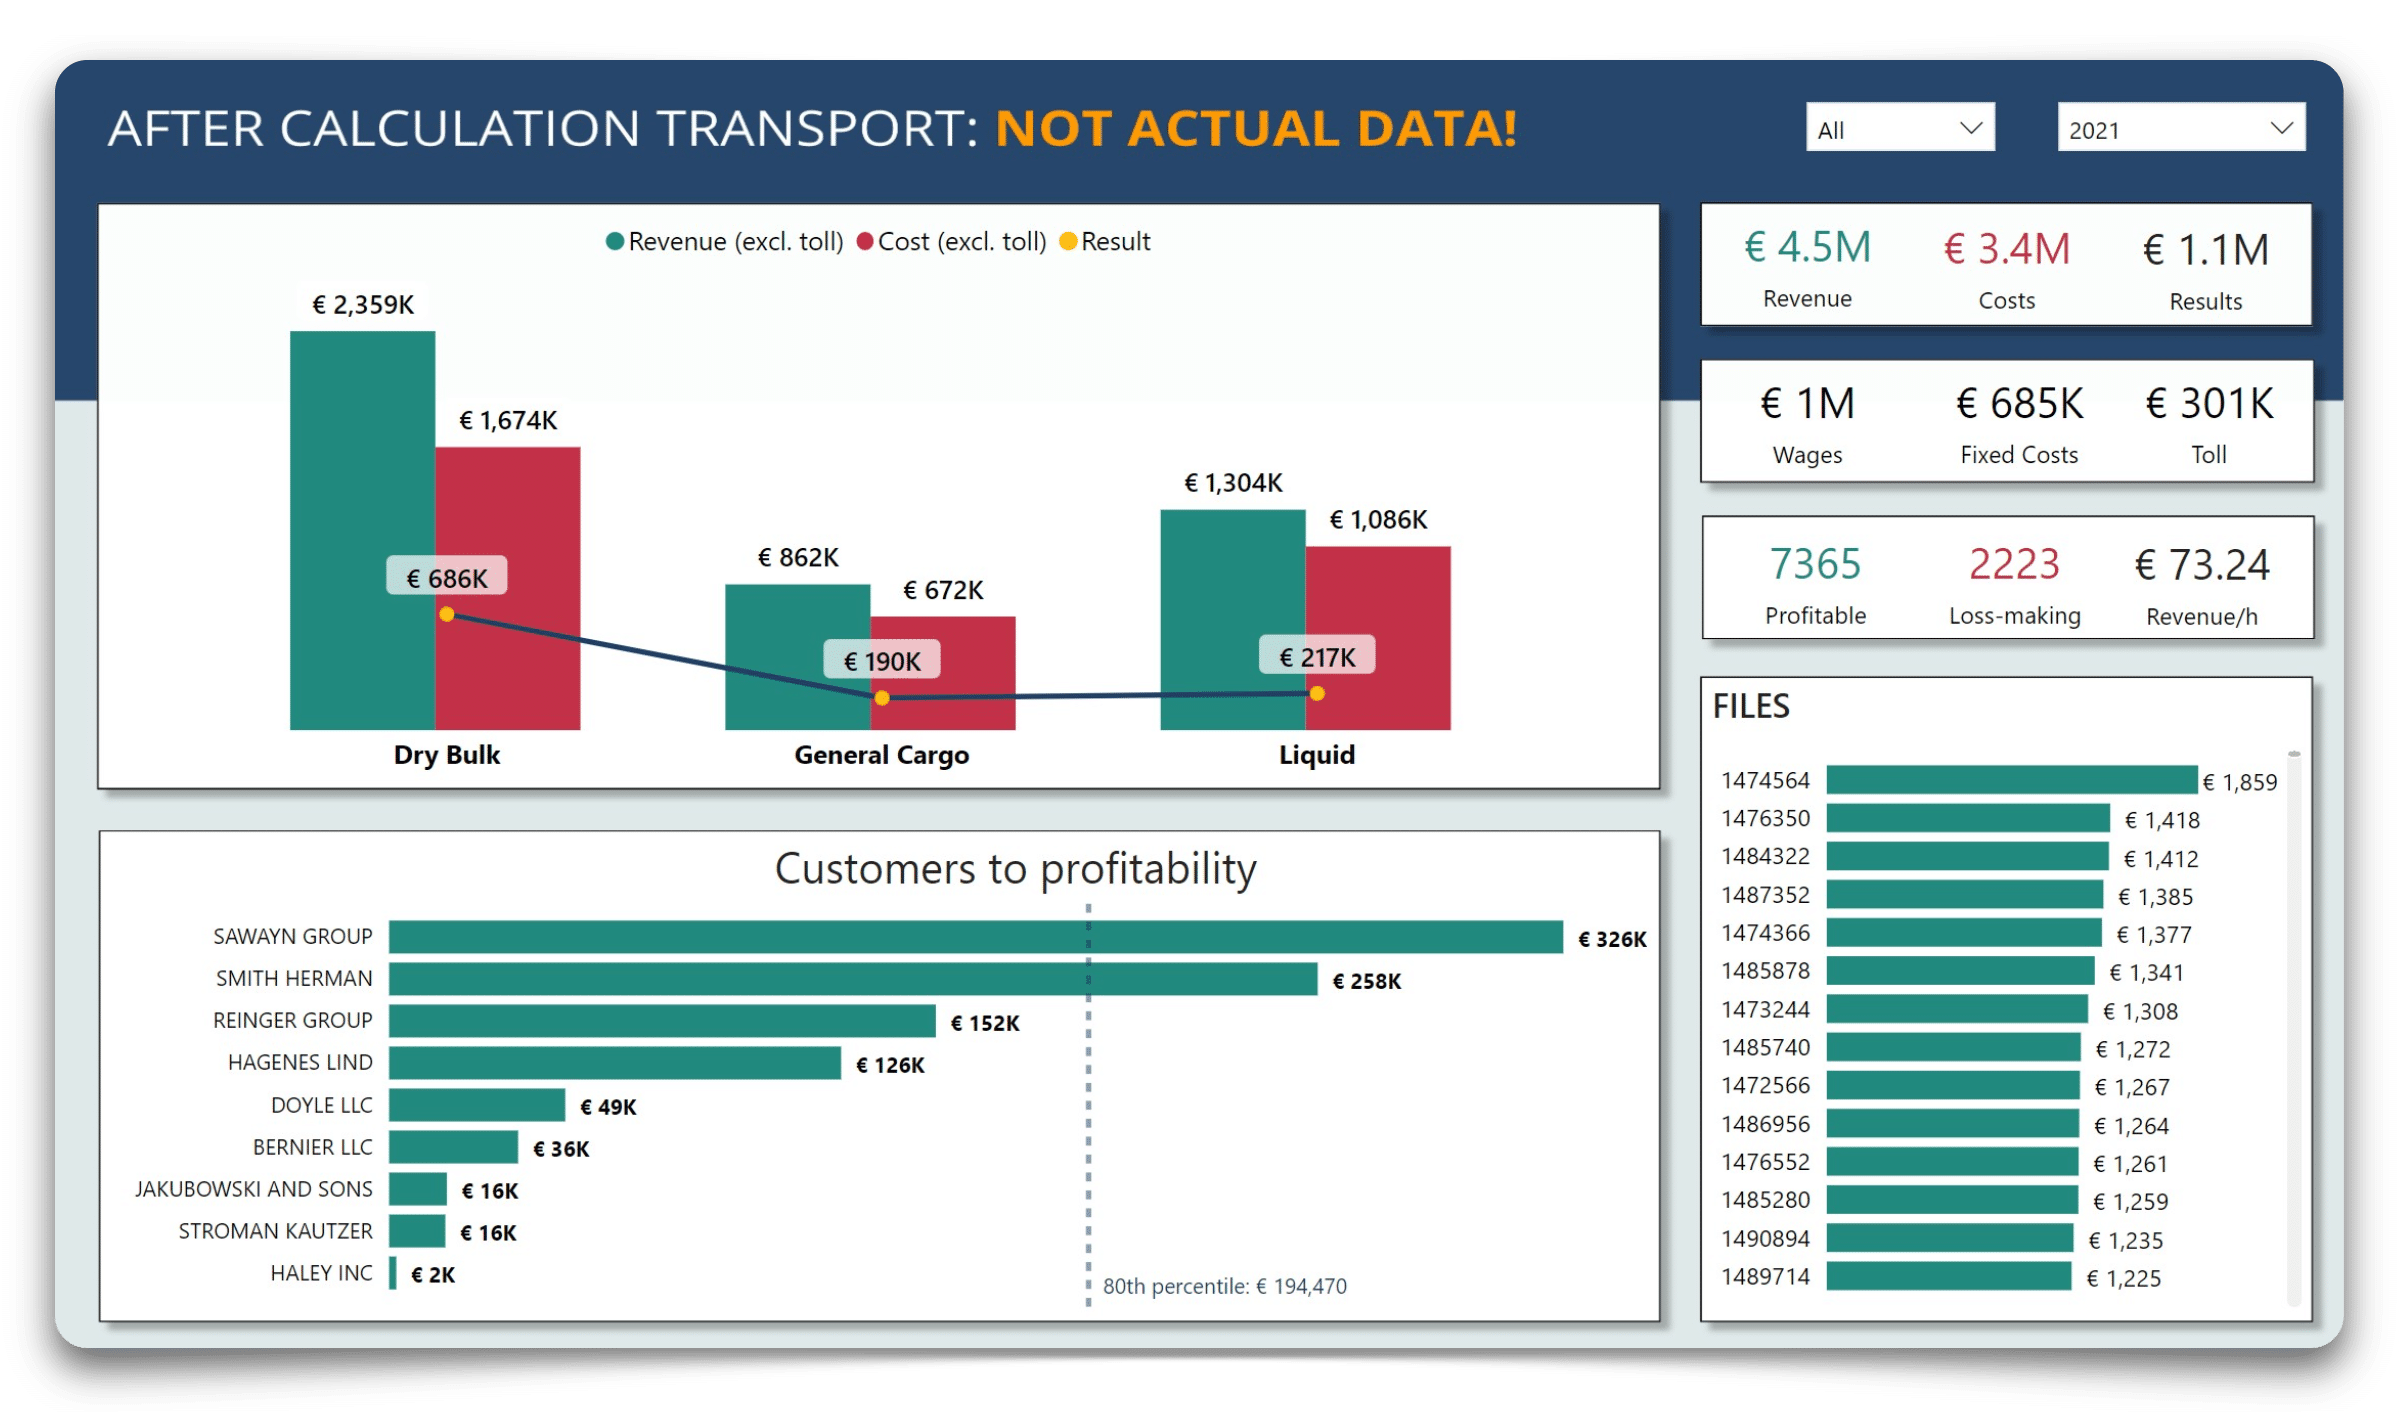
1. Open the dashboard once a week
At the top you select a period to filter the dashboard. At the top right, you can immediately see some important KPIs. I always keep an eye on turnover/hour. It drives our turnover and says something about our efficiency.
Centrally, I see the results per division. At the bottom are the names of our customers, ranked by profitability. On the right, we see a long list with the results of our trips in this period.
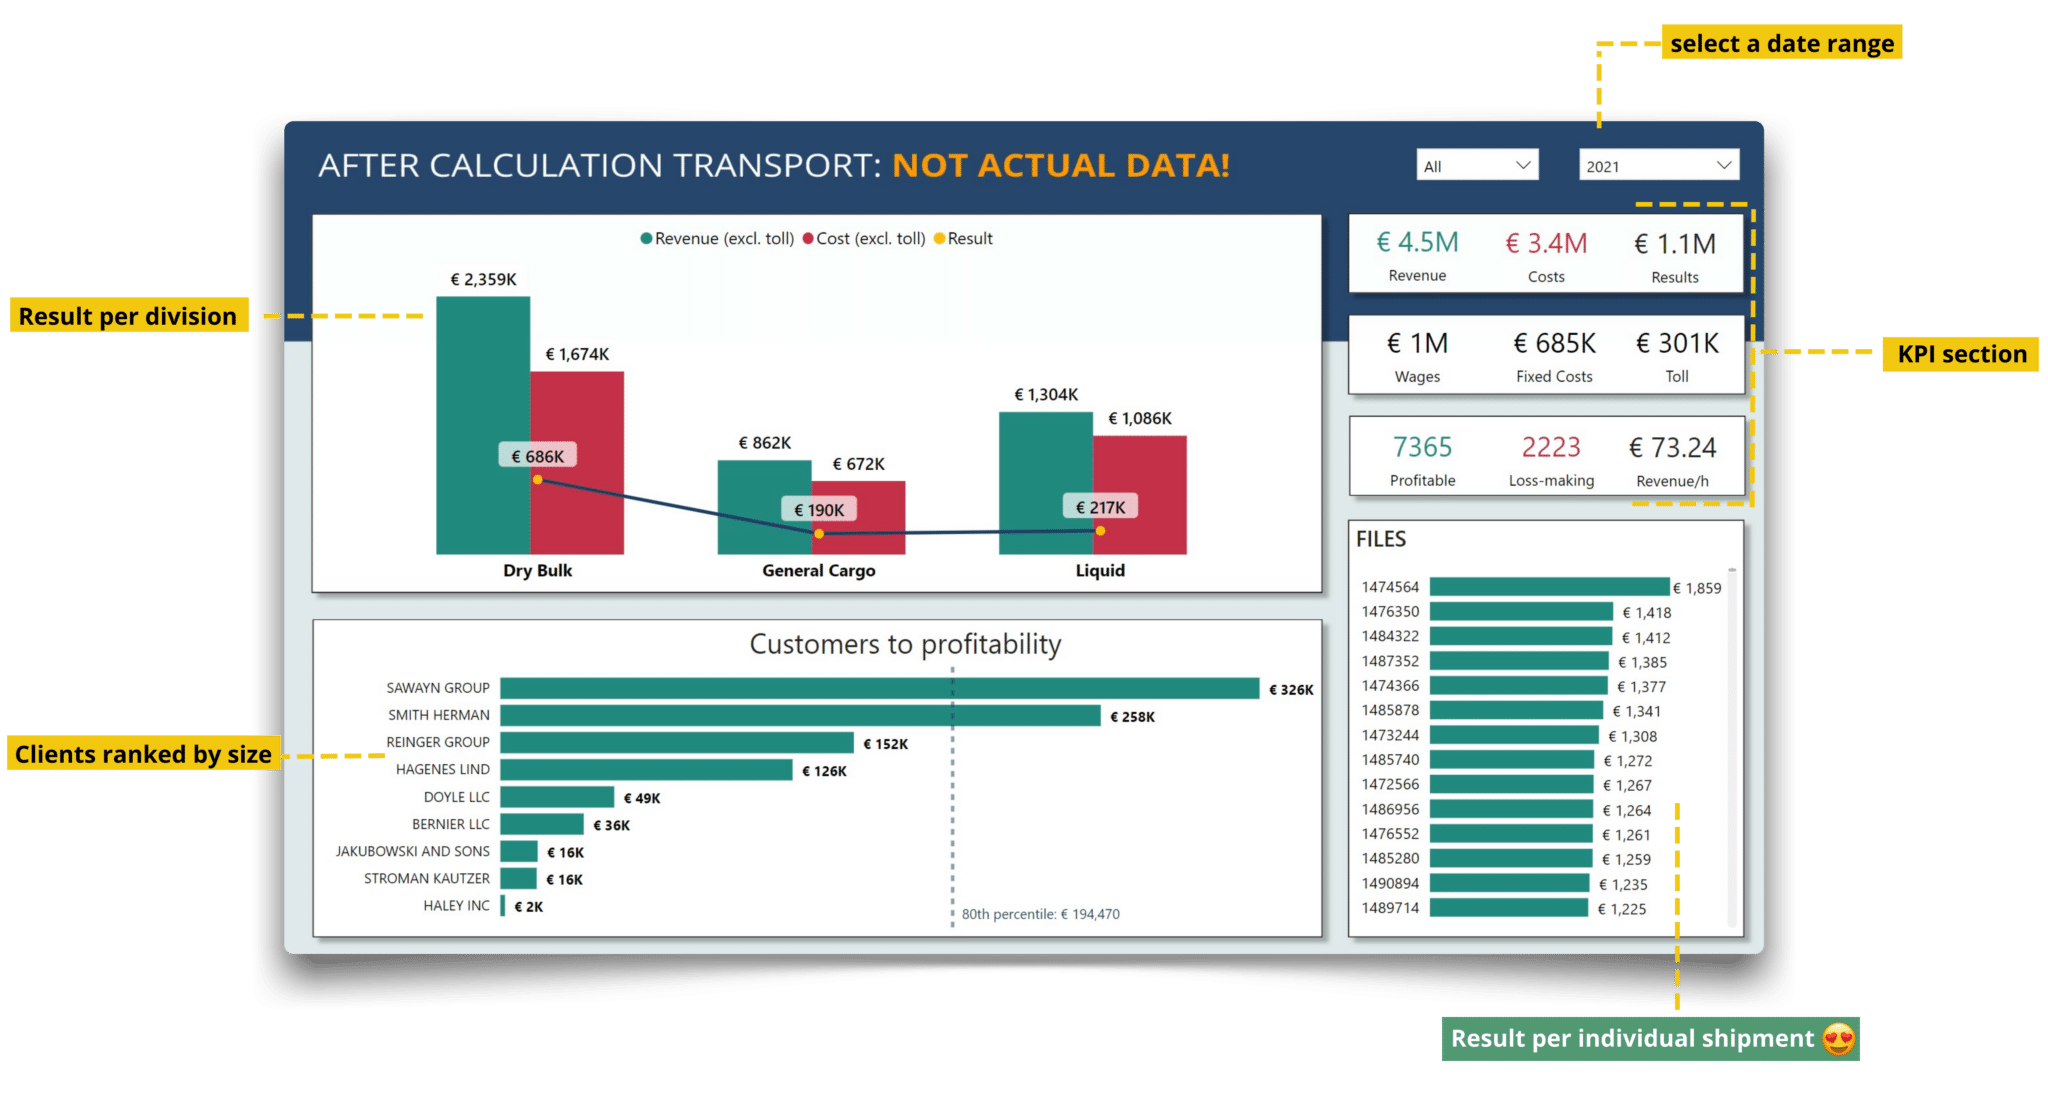
2. Select dry bulk division and select 1 client
At the top you select a period to filter the dashboard. At the top right, you can immediately see some important KPIs. I always keep an eye on turnover/hour. It drives our turnover and says something about our efficiency.
Centrally, I see the results per division. At the bottom are the names of our customers, ranked by profitability. On the right, we see a long list with the results of our trips in this period.
3. Select one shipment to analyse in detail
With just two clicks we move on to a detailed overview for one shipment. At the top we see some important data for the shipment with number '1473244'. On the left, we see a breakdown of the costs. Note that this also includes diesel consumption, depreciation of the truck, overnight stays and overhead costs.
There is also a time breakdown per activity as a percentage of the total time worked. Was the driver stuck in a traffic jam? Or did he lose time mainly unloading?
Download our dashboard portfolio.
Learn how BI can help your company.
✔ Management dashboards
✔ Financial KPIs
✔ Power BI examples
✔ Free advice