Business Intelligence flourishes when it can combine data coming from multiple systems. Even better when these systems have high volumes of data. This is why the transport and logistics industry suits perfectly for BI. In this story we present you the case of Transport De Rese, a 3rd generation family company based in the heart of the West-European logistics landscape. Or how the management team can now analyse every single trip, client or driver to a level of granularity not seen before.
- Title: Cost-calculation management dashboard
- Customer: Transport De Rese
- Budget: 9 days
- Data sources: Navitrans (navision), Trimble, VolvoConnect, Excel
The Family Company
After studying in Ghent and Antwerp, Milan De Rese had all the academic logistic background he needed. Therefore it was time to start helping his father in the family business. Milan walked through multiple roles and saw different aspects of the company, ranging from planner to administration and driver support. Today Marnix and Milan De Rese are in charge of the daily operations. Together with their team and fleet of 115 trucks, they operate in the heart of the European logistics centre.
The Industry
"Due to our location in the port of Zeebrugge we were highly affected by the Brexit over the past few years, and we still are. This caused us to postpone the data analytics part of the story a couple of times. However, now that we have the dashboards, it is clear that you just need to get started," Milan says. Make things visible so you can start improving them.
Transportation via road has very high volumes and rather low margins. It is extremely important to monitor your costs if you want to stay profitable.
Milan De Rese
Obviously, the cost components play an important role in our industry, but there is more than that. We have 4-5 other KPIs like revenue per hour driven, revenue/result per KM driven, avg. fuel consumption, profit margin per client... We can now even see in detail how long our drivers take to load/unload at different client locations.
Being able to track and see these KPIs per customer, driver, and shipment is nice. What really makes the difference is seeing these KPIs evolve over time.
Milan De Rese
The Data
On the revenue side this is rather easy. Each invoice to the client has a part for the trip and a surplus for the toll. The big challenge in this project was to define, identify and track all the costs inquired for each trip individually and for the company as a whole. Obvious ones are the labour costs of the driver (to the minute) and the fuel cost of the distance travelled.
We wanted to have a complete view of the after cost calculation, that means we took everything (measurable) into account.
Milan De Rese
But we also included or excluded write-downs of the fleet, the office overhead costs, overnight surpluses, weekend surpluses, unpaid breaks and so on. A lot of decisions had to be made.
Like many other (logistic) companies we make use of multiple software systems. For a long time we could not combine the data.
Milan De Rese
We at Power Partners particularly liked the geolocation data of this project. The trucks and their board computers register thousands of data points month after month. This opens doors for more, in-depth analysis on routes, traffic, load and unload locations... and all kinds of other optimizations. More than enough content for future projects.
The Dashboards
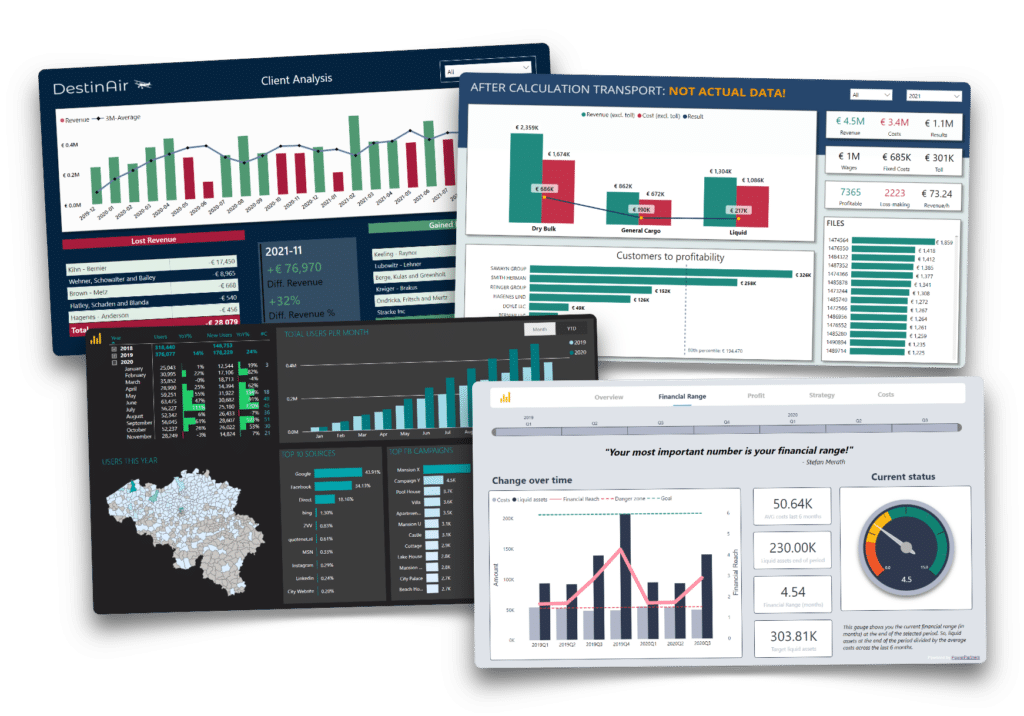
Step 1: make a selection for a division and/or a client
Transport De Rese, like many other companies has multiple divisions. Dry Bulk, General Cargo and Liquid are shown in the bar chart above. Each show the revenue and the costs of the shipments that were executed in that division. When you select 1 division, the other visuals will be filtered. E.g. select "Dry Bulk" to only see the clients and the shipments in the "Dry Bulk" division.
Step 2: Analyse a specific shipment in more detail by right-clicking
The visual on the right shows the profitability of each individual shipment. You can analyse every shipment in more detail by right-clicking the bar and using the drill through function.
Step 3: See how the cost and time distribution was for this shipment.
You might want to know the exact diesel cost, the total time driven or maybe you even want to know where the driver was stuck in traffic. All of that you can easily do in this detail overview. We are interested to know how much time do our drivers require on average. We can do this by right-clicking the red deposit box.
Step 4: How much time do our drivers need on average?
-This page is not available in the anonymized version of the dashboard. If you would like to test it out yourself, do not hesitate to contact us.- We now see all the load and deposit activities for this client/location. Every dot shows 1 activity. The bigger the dot, the longer it took the driver to execute the activity. On the right you see all the individual times from the drivers as well as the average time duration needed. Little extra for the advanced Power BI user: if you would like to analyse 1 shipment in detail, you can do that by right-clicking the file and using the drill through function.
Try the anonymized dashboard yourself
Download our
dashboard portfolio.
Learn how BI can help your company.
✔ Management dashboards
✔ Financial KPIs
✔ Power BI examples
✔ Free advice

