Now that many companies are forced to reduce their activities to the absolute minimum, for many it is more survival than life. We are convinced that it can be an opportunity to zoom out. Just like previous recessions and crises, this Corona crisis will also disappear. We believe it pays to take a look at "the bigger picture". How has your business performed over the past 3–5–10 years? Was the company still on the right course before this crisis hit? Or maybe it's time to make adjustments and make some decisions?
Power BI
Big data & artificial intelligence, "the next big thing", you will probably have heard about it before. Algorithms that will decide on our loans, drones that deliver packages, news anchors that spread fake news, those kinds of stories (link).
As an SME country, Belgium is lagging worryingly behind. Most companies do not go beyond an advertising brochure with personalized offers.
Stilton
Companies are facing a gigantic digital challenge, that much is certain. However, we are convinced that things will not go so well. Many companies are still at a much earlier stage. Mapping data, setting up the right relationships, making simple analyses and visualizing core data already takes many companies a long way towards more informed decision-making.
Okay, so I have to think about the data in our company. How do I get started?
Thanks to Microsoft, this is now easier than ever. With their Power platform they open up the world of Business Intelligence for small and medium-sized enterprises. You no longer need huge IT resources and data scientists to extract tangible information from your data. Interactive reports, live data, built-in integrations with your CRM, ERP, social media accounts... There are almost no limits to the streams of data that you can store, extract and visualize in the platform.
No more plodding in excel files.
An example
Two weeks ago we published a financial dashboard for companies in Germany (link). Here, at PowerPartners, we haven't been sitting still since then. For our next dashboard, we went after the Flemish SME market. As you may know, all Belgian companies are obliged to publish their annual accounts. Anyone can consult them at the Central Balance Sheet Office of the National Bank (link). These standardized PDF files hide a lot of information. Every year, all these companies (but also their competitors, suppliers, B2B customers) publish data about their finances, investments, debts, employees...
Benchmark the financial performance of your company
Deloitte
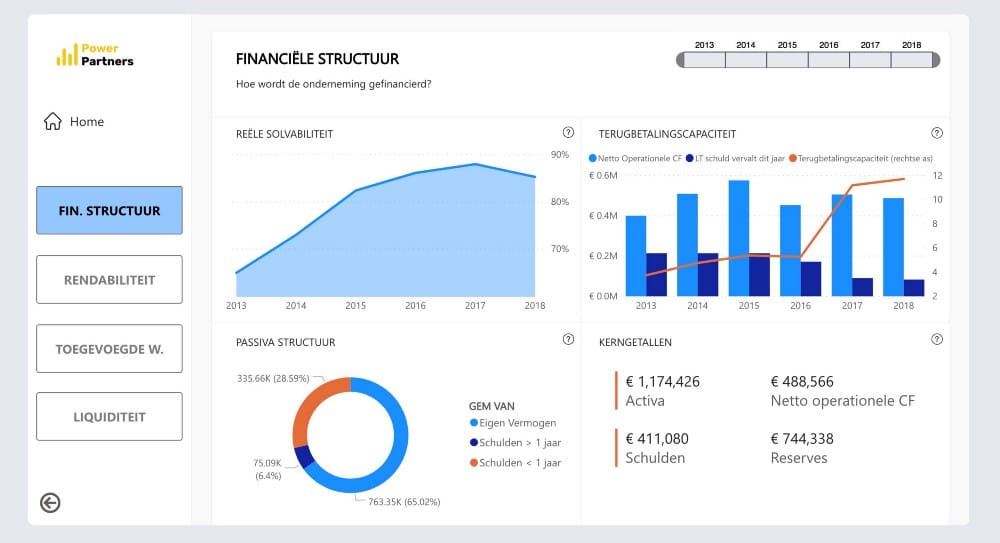
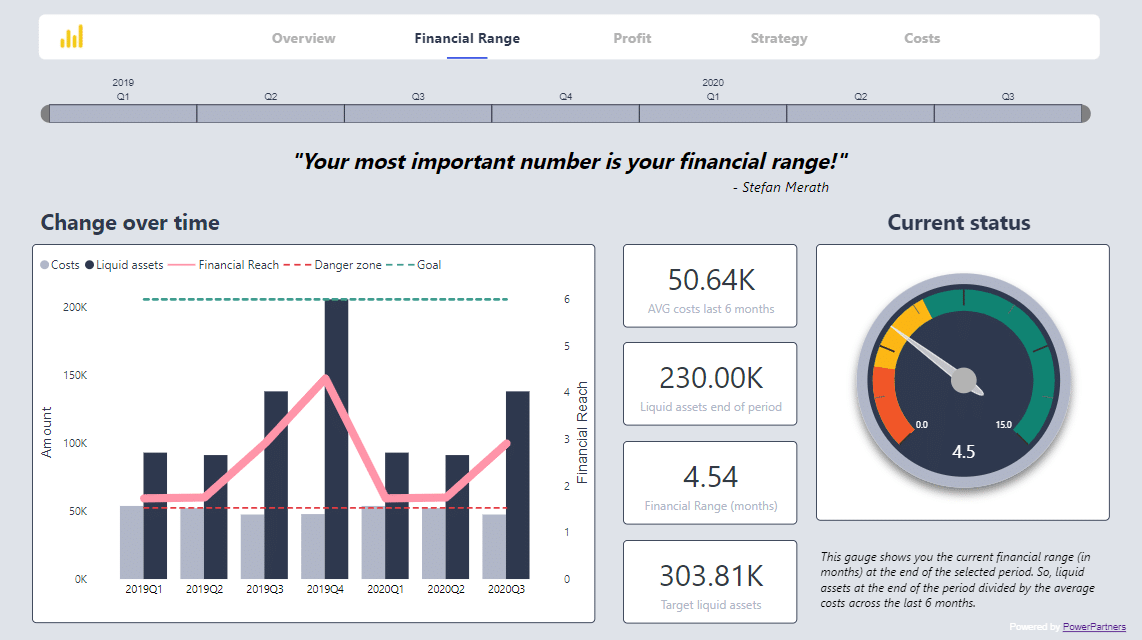
Our dashboard is aimed at displaying the financial performance of the company. We based ourselves on the KMO Kompas report of Deloitte (link). Based on the most important ratios in terms of financial structure, profitability, added value and liquidity, this dashboard outlines an overview of your company over the years.
The dashboard(link)looks simple and user-friendly, but in the background it does something very interesting. We developed some algorithms to draw the data from any financial statements (VKT and VOL) and to aggregate it in the model. This means that the user only has to save his annual accounts in a folder 1 time a year and everything else is generated automatically. Pretty cool, no?
Imagine what this dashboard could mean for your company if we 😉 your monthly data, marketing data or the data of your biggest competitors.
Would you like to receive this dashboard for free for your own company? Send me an email: [email protected] and I'll deliver it to you.
Link to full dashboard

