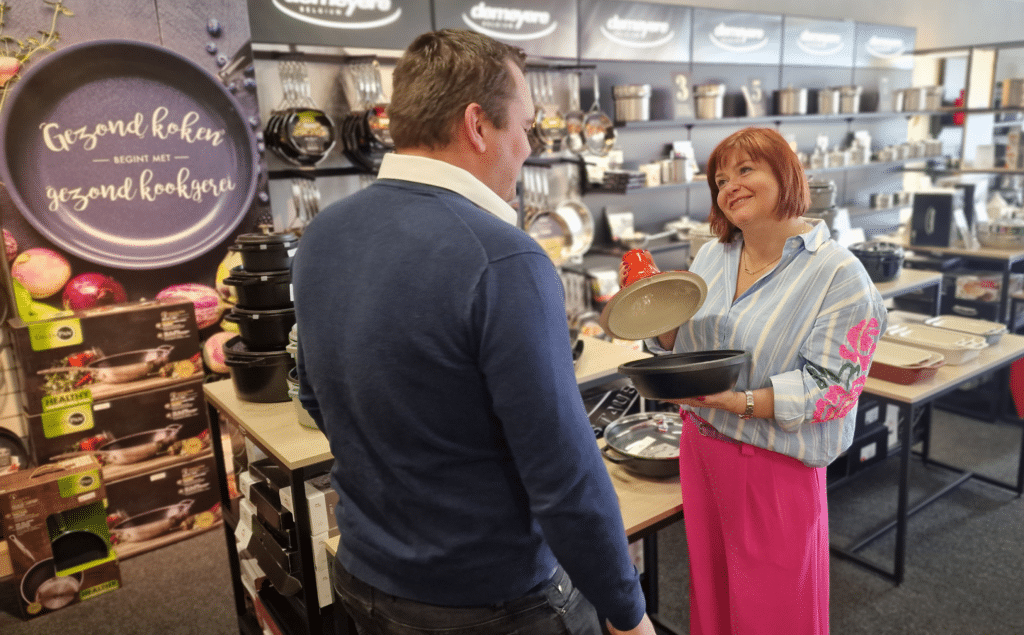
Profilec is a growing family business that focuses on e-commerce through various online channels (webshop and other marketplaces), as well as a physical store with a warehouse in Bruges. The company sells tens of thousands of different products with often fluctuating prices to consumers in Belgium and the Netherlands. To better manage all these parameters, Profilec now uses Power BI dashboards.
- Titel: Power BI in the E-Commerce wereld.
- Budget: 11 days
- Datasources: Logic4, Bol.com & Excel
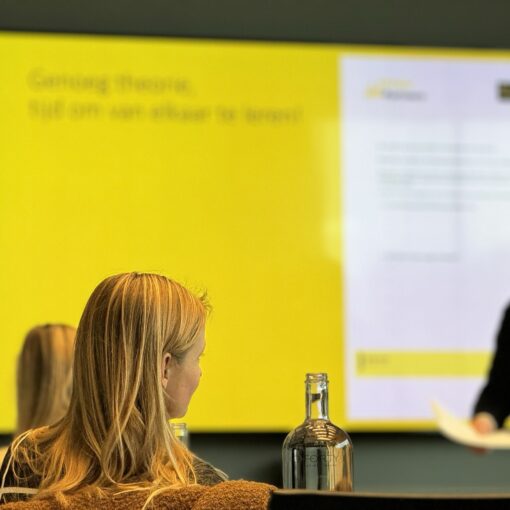
Sharing business knowledge
Frederic and Peggy are the managers and second generation within Profilec. After more than 25 years, they know all the ins and outs of the business. But that doesn't mean it has always been easy. Retail is a sector that has undergone a true transition in recent years. The rise of online webshops brought big challenges, but also opportunities.
The dashboard helps me share my 25 years of experience with my team, as well as maintain an overview of my company from a helicopter perspective.
Frederic Penel - Profilec Electro
By expanding the Profilec webshop and responding to the growth of marketplaces, Frederic and Peggy have succeeded in growing the business like never before. As a result of their years of work, Frederic and Peggy have developed a specific and successful approach that has paid off.
The next challenge that arises now is: how can we share the knowledge and experience accumulated over the past 25 years with our employees?
Company Overview
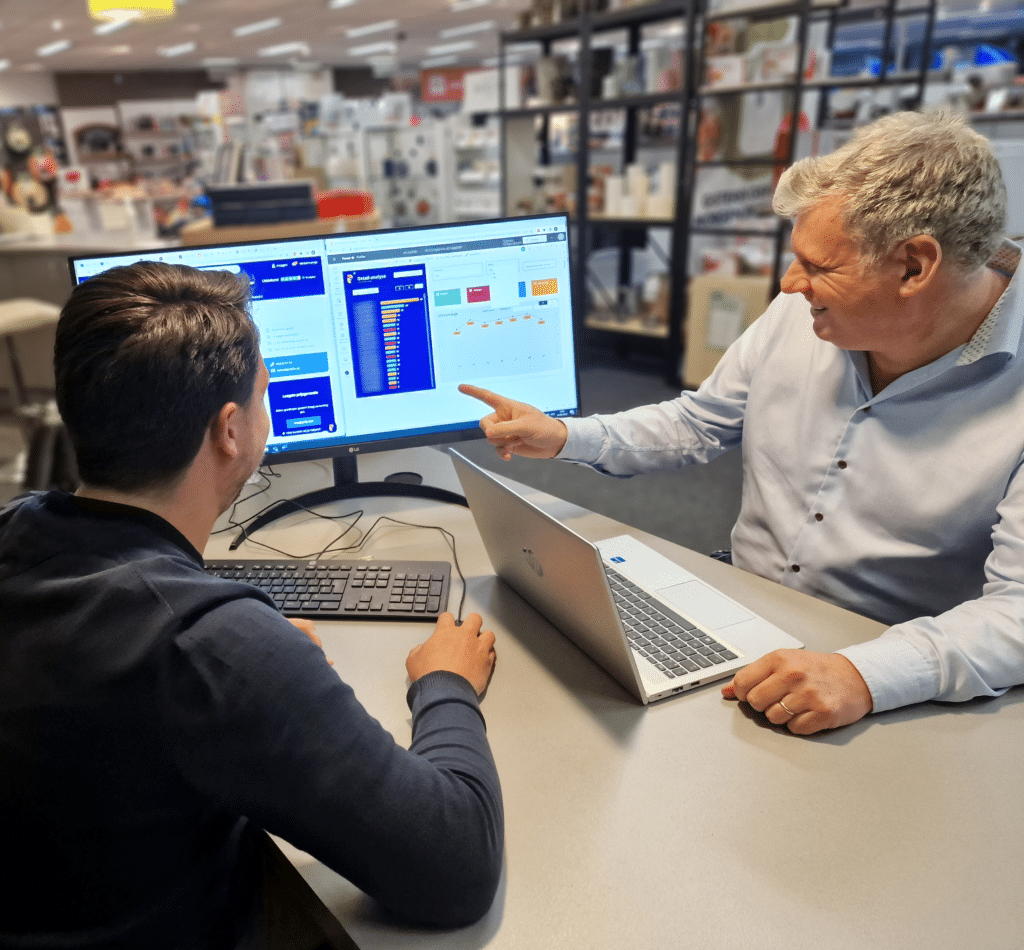
The company overview dashboard allows Frederic and Peggy to view their three different channels (store, webshop, and marketplace) at a glance based on revenue, volume, customers, and returns, both in absolute numbers and in trend form, for example, evolution over the past 5 years.
As a management team, we want to track profitability per channel every day.
Peggy Baert - Profilec Electro
The dashboard helps Profilec keep large amounts of data under control and intervene quickly when there is a deviation in one of the sales channels/brands/products.
Detail Analysis
In addition to the company overview dashboard, there is also a detail analysis dashboard that is actively used by the online sales manager. Using various filters, he/she can quickly perform analyses on:
A. Different dimensions:
- Brand
- Product group
- SKU
- Sales channel
- Period
B. Different KPI's
- margin €
- margin %
- volume
- returns
- etc..
By combining the 2 dashboards, an intelligent platform is created that mimics Frederic's knowledge and supports his team from various perspectives.
A marketing manager wants to know:
What are our top 3 best-selling brands on bol.com within the "large electronics" product group in the past 6 months?
| Time filter | 180 days ago |
| Channel filter | Bol.com |
| Category filter | Large Electronics |
| KPI | Revenue € |
What is the difference in gross margin (%) between AEG and BOSCH dishwashers that we sold in-store in the past year? The marketing manager wants to know which of the two photos (AEG/BOSCH) to use for a new Facebook post about dishwashers.
| Time filter | Last year |
| Channel filter | In-store |
| Category filter | Large Electronics |
| Sub-category filter | Freestanding dishwashers |
| Brand | AEG and BOSCH |
| KPI | margin % |
Complexity
One of the challenges during this project was the large amount of data. Profilec has a product table with over 100,000 SKUs. In addition, the analysis had to be based on invoice lines (transactions). As a result, we had several million entries. This dataset is refreshed every night so that the team has up-to-date insights.


An additional complexity arose from the many different purchasing conditions that Frederic and Peggy negotiate with their suppliers. This was extensively discussed during the kickoff consulting day. These specific conditions are not stored anywhere in the ERP system. In addition, all these conditions must be checked against the millions of invoice lines.
How will we take this into account in the dashboards?
Frederic and Peggy keep track of these and other parameters in Excel files. The files are connected to Power BI and are filled in once a year after negotiations with the suppliers. The logic built into the files turned out to be too heavy for Power Query. Therefore, we decided to move the transformations to Azure Data Factory. There, we perform the heavy lifting every night. The Microsoft platform is flexible, and depending on the case and budget, we choose the most suitable solution.
Power BI and Azure offer a wide range of possible solutions. There is an alternative for every budget.
Jules Vandierendonck - Power Partners


Customer service
As an electronics retailer, Profilec is naturally focused on monitoring margins and volumes, as we read earlier in this article. But that is far from the only area where Frederic and his team focus. Another key point in their strategy is providing optimal service for online and offline customers. It's not just empty words, as you can see from the 857 reviews on Trustpilot and a rating of an impressive 4.7/5!


A good customer service can contribute to fewer returns. Satisfied customers are more likely to buy from Profilec again, leading to a higher retention rate. Once again, this has a positive impact on the team's KPIs!
In short, good customer service can make a big difference in customer satisfaction, retention rates, revenue, returns, and reputation.
For Profilec, customer service is clearly a key KPI. It has an impact (directly or indirectly) on almost all factors in the business.
What is the key KPI within your business? Let us know!
