Content
1. What is the secret behind successful Power BI projects?
Since the foundation of Power Partners in 2020, Christoph and Jules have been continuously looking for ways to support growing SMEs in the BENELUX and DACH region in their BI journey. With more than 60 companies helped, our Power BI workshop has proven to be the key to success. It is the start of every BI project and provides the blueprint for a sustainable data-driven story.
In this article, we share our process, including mistakes we made (so you can avoid them), tips, and a roadmap to get started yourself.
This article is structured as follows: we start by defining the target audience for this Power BI workshop, followed by positioning it within the framework of a BI project(Design, Build, Integrate). We will then go through the eight phases of the workshop step by step, so that you and your team can get started with this on your own.
This workshop will give you the tools and knowledge to build powerful, live dashboards that support multiple business units and make your organisation data-driven.

2. Who is this workshop designed for?
The workshop is specifically designed for executives and teams within companies with 20 to 250 employees who have already taken initial steps towards a data culture. Although many companies have already experimented with Power BI or gathered information on it, they often lack the structure to use these insights in a targeted and scalable way.
Perhaps you have already attended a training course at VOKA or dived into the many YouTube tutorials. Or do you have no experience with Power BI yet and are currently working with Jet Reports? What really matters is your ambition to use data more actively and consider reporting as an essential pillar within your organisation.
In brief:
✅ Do you want to use your data more actively?
✅ Are you actively involved in operational management?
✅ Do you consider reporting an essential pillar within your organisation?
➡️ Then this Power BI workshop is perfect for you! 🚀

3. The three pillars of a successful BI project
Design - Build - Integrate
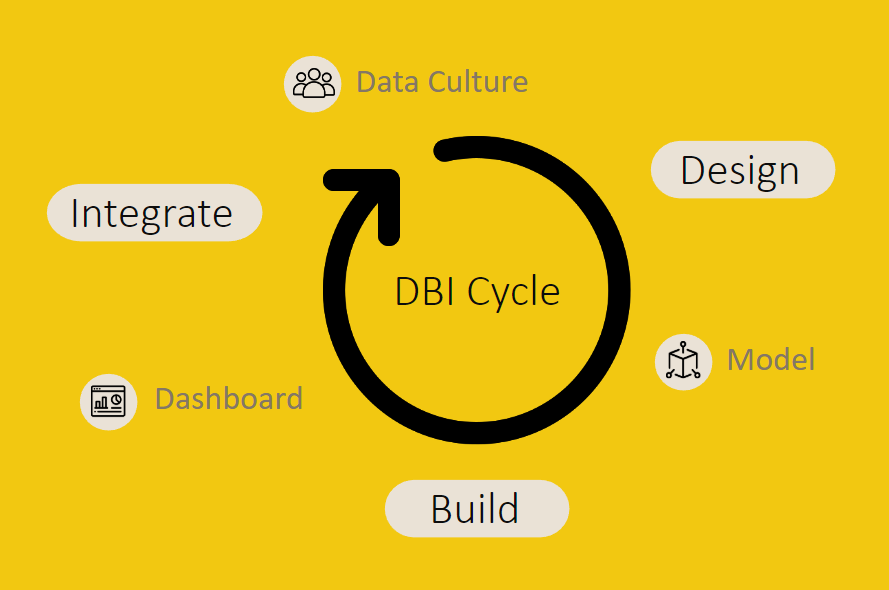
A Power BI project ideally goes through three phases: Design, Build and Integrate. We like to clarify this process with the following metaphor:
- Design: The entrepreneur or manager (the builder) works with a BI expert such as Power Partners (the architect) to create a clear design. This defines the needs and expectations.
- Build: Execution starts. The developers (the contractors) build the solution, while the BI expert as project manager oversees and checks that everything meets the predefined requirements.
- Integrate: The project is completed and the key is handed over to you. Just as you continue furnishing a new house, you now get access to fully finished dashboards. You can use these immediately to gain valuable insights. In addition, through our training courses and customer events, you will learn how to customise dashboards or even build them from scratch.
By dividing a BI project into these three phases, we ensure a structured approach. The average lead time of a complete BI project is around three months.
Design: translating business logic into a model and plan of action.
This workshop is the most important part of the design phase, here we lay the foundation for the entire Power BI project. The build and integrate follow later, but a successful BI project starts with a strong design. In this phase, the entrepreneur and the Power BI expert work together on the blueprint of the BI solution.
Many entrepreneurs are convinced that their business goals are already crystal clear and therefore see little value in extensive strategic workshops. In our Power BI workshop, we focus not on what you already know, but on how you can practically translate that knowledge into a dynamic data model. This model helps to load and visualise data in a consistent and scalable way, allowing both the entrepreneur and the team to always look at the numbers in the same way.
During this phase, we work together on:
- Writing out your key business goals in a structure that is measurable.
- Building a flexible data model that forms the basis for consistent reporting.
- Defining an approach to visualise data in a standardised and repeatable way .
In the following sections of this article, we will go through step by step how this phase is worked out so that you can already prepare yourself.
4. Your Power BI blueprint in 7 steps
To keep the process structured and interactive, we recommend taking notes at each step and keeping them visible to the whole team at all times. This ensures that everyone can refer back to previous insights when needed.
We use large laminated boards placed on the table to keep an overview and encourage interaction. You can also use a whiteboard, as long as it is clearly visible to everyone.
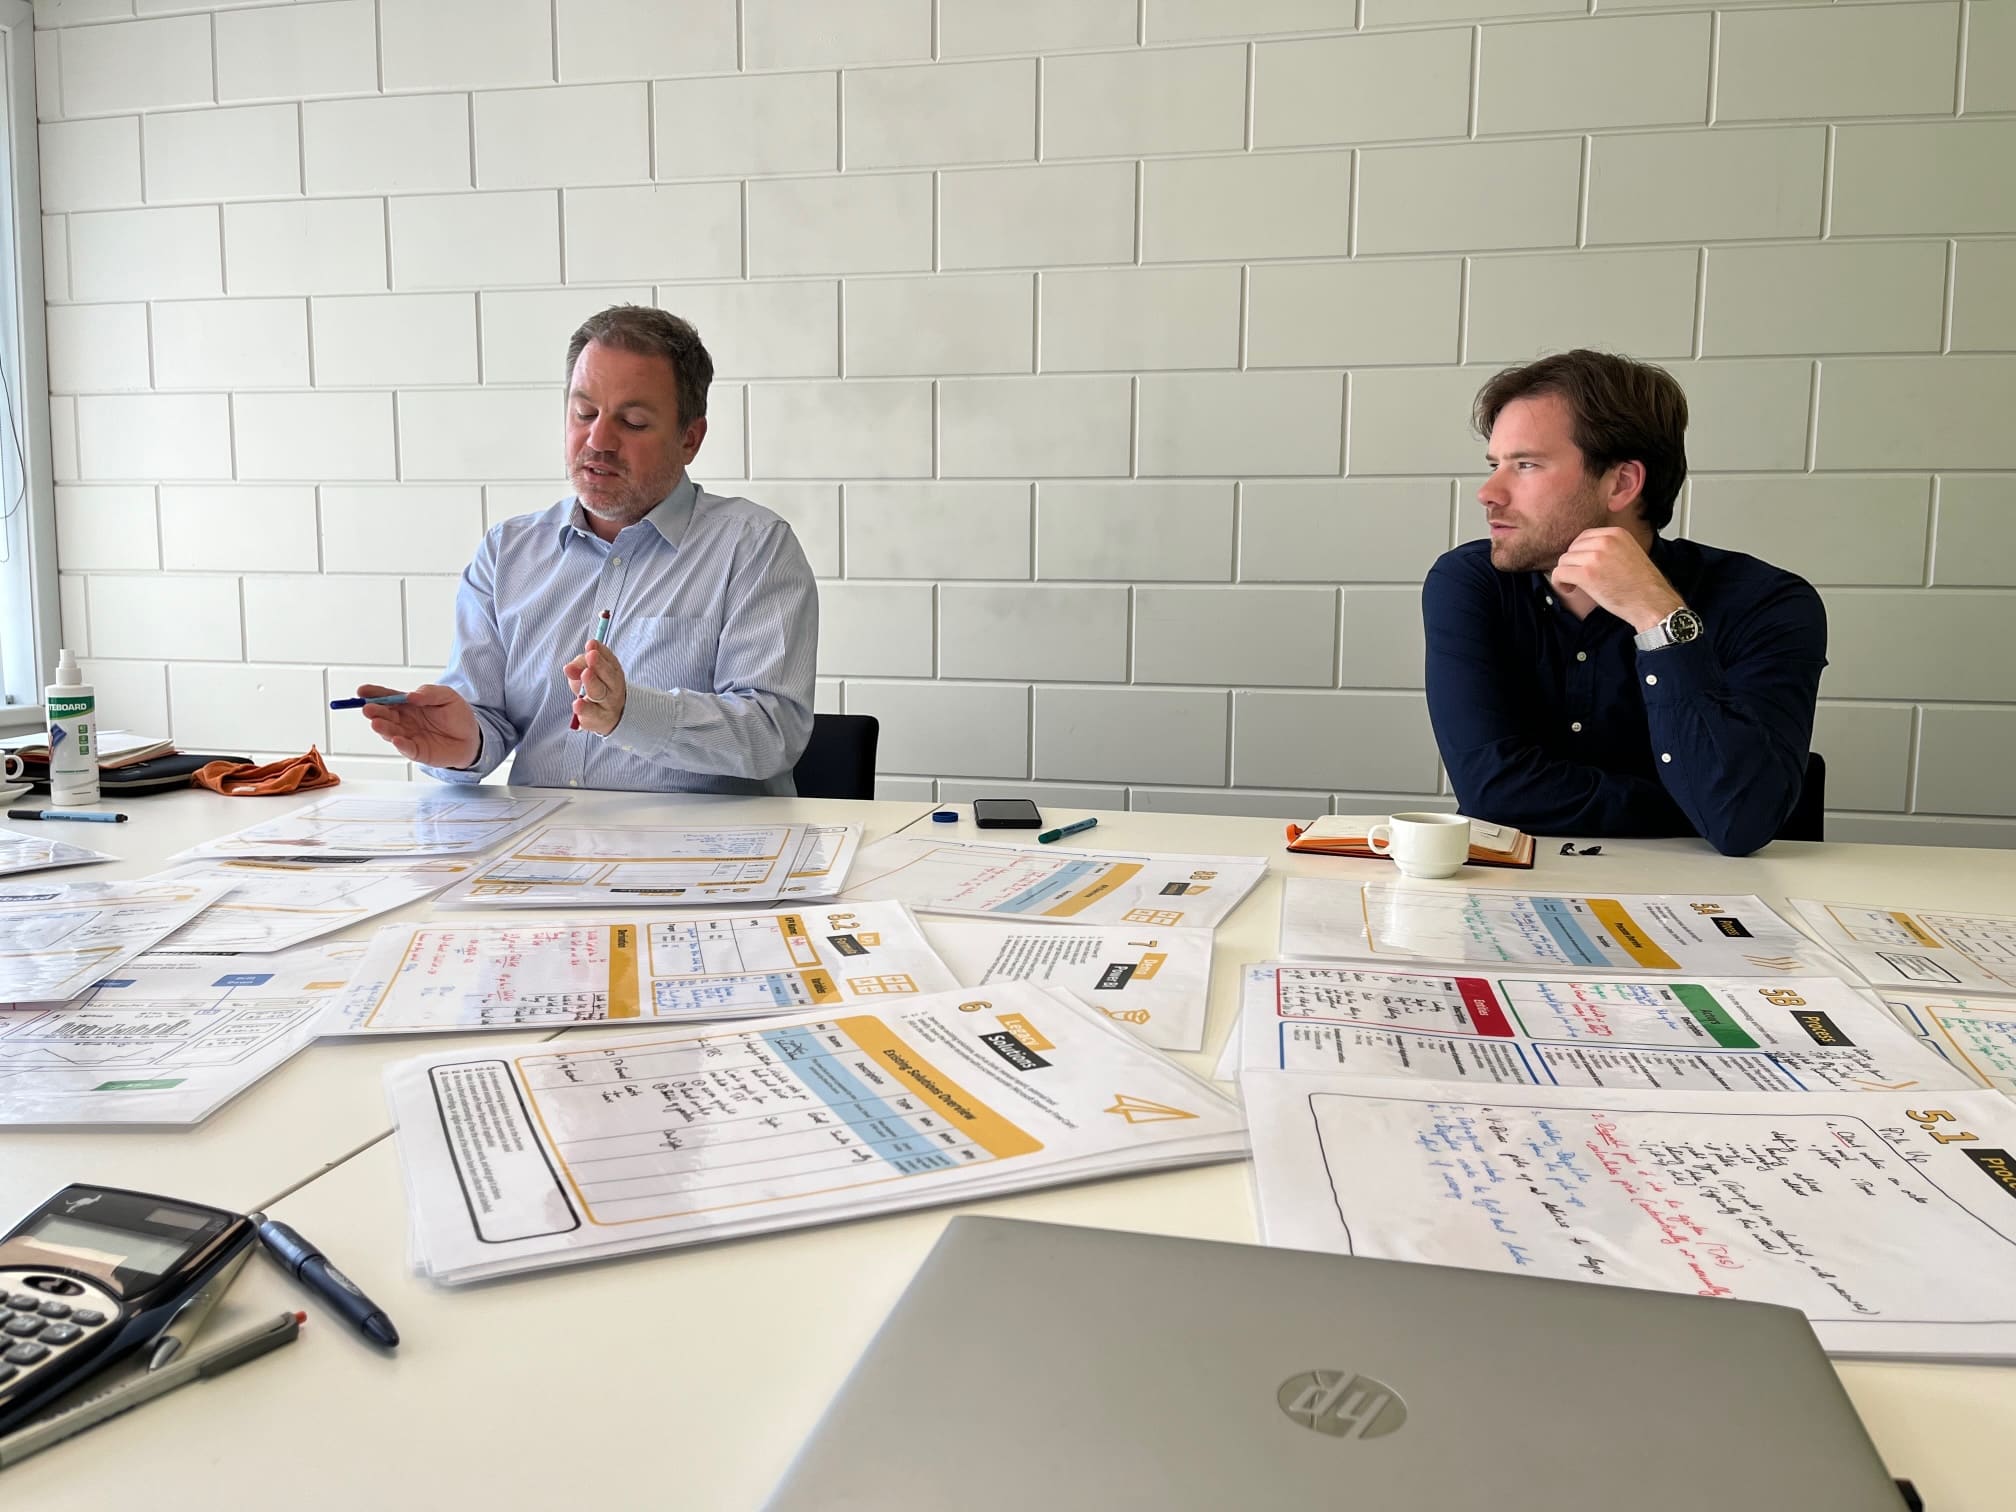
In addition to the 7 steps of the workshop, we recommend using four additional theme boards. These boards will remain continuously available and will be supplemented throughout the workshop:
KPIs
- Make a note of each KPI raised during the workshop
- Define the formula immediately.
- Start with a maximum of 10 KPIs to keep focus.
- e.g. the conversion ratio of the sales department.
Conversion ratio (Number)
Conversion ratio (%) = (Number of orders / Number of quotations) × 100%
Conversion ratio (€ value)
Conversion ratio (%) = (Total order value / Total offer value) × 100%
Terminology
- Note terms that may be open to interpretation.
- These words recur in the charts, filters and the data model.
- Important to draw 1 line in this and stick to it.
vb. Company, entity, business unit - what exactly do we mean by this?
Data sources
- Map all relevant data sources
- ERP, CRM, WMS, Excel etc
- but also non-structured sources.
An email every week with stock data from a supplier? - Write it down!
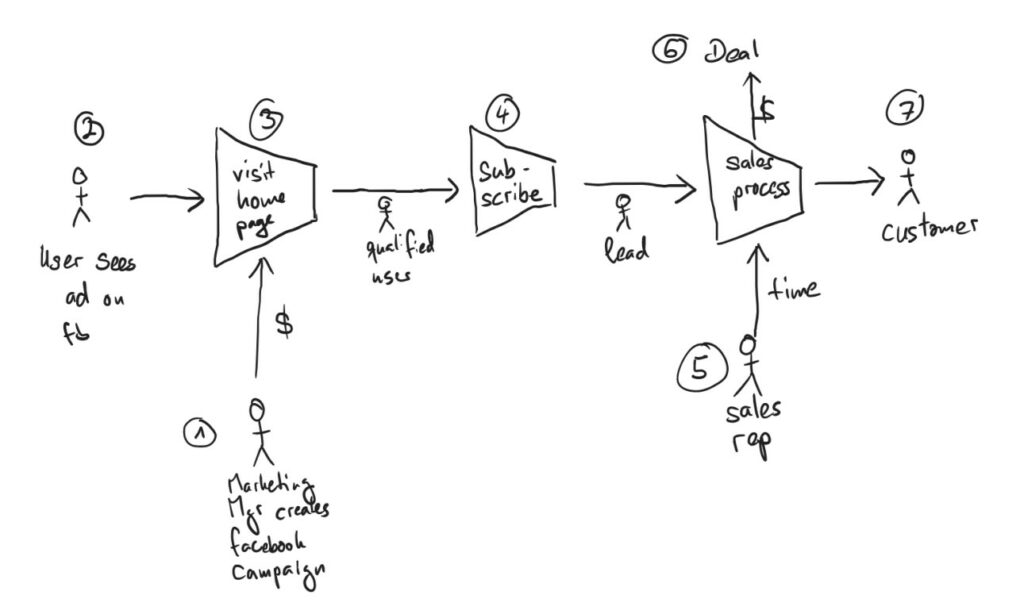
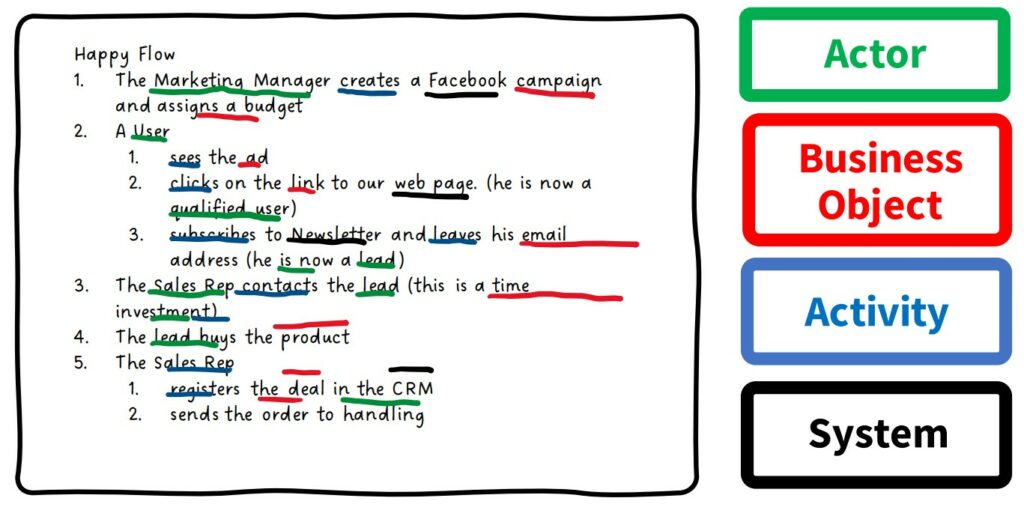
Processes
- Write down the business processes cited during the workshop.
- Focus on describing the data flows and actors.
- Describe the "Happy Flow" - the situation as it runs normally.
- Stay high level, this is not intended to achieve an ISO certificate.
vb. Marketing process
4.1. Expectations
A good start to the workshop starts with clearly formulating expectations. Let everyone speak one by one. We split this into two parts. Don't forget to write down the results of the discussion.
Duration: 30 min
A. Expectations of the workshop
What do you definitely want to have achieved by the end of the day? Below are some examples, but these are certainly not exclusive. Consider:
Content goals
- Gaining insight into budget (internal/external)
- Clarity on the feasibility of self-service BI
- Establishing a realistic timeline
Minimum requirements
- What is the absolute minimum to be achieved today?
- Which topics should definitely not be forgotten?
Success indicators
- What results would exceed our expectations?
- What would make the workshop extra valuable?
B. Long-term expectations
Think beyond today, consider the "final destination" of this journey. Where do you want to see your company in a few years after implementing this Power BI solution?
Strategic goals
- The management team works with the same insights
- We gain a competitive advantage in the market
- Investors have confidence in the figures
Operational impact
- More efficient decision-making through data-driven insights
- Cost reduction and business process optimisation
Vision for the future
- How does BI support a possible transfer to the next generation?
- How can BI contribute to a successful sale of the business?
- How can BI contribute to an acquisition in a new market?
4.2. Perspectives
Each company is looked at from different perspectives: sales, finance, marketing and operations. Each team has its own focus, but as an entrepreneur, you need to switch between these glasses on a daily basis.
Duration: 45 min
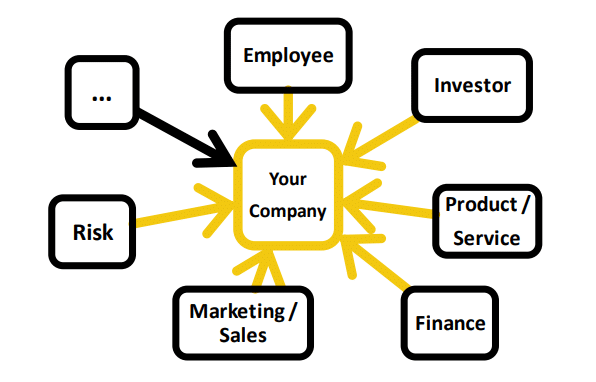
Imagine a cockpit in which you can see at a glance how your company is performing. Each pointer in this cockpit represents a perspective within your company-whether in sales, finance, marketing or operations. When something goes wrong, you want to notice and adjust immediately.
Power BI helps you keep these insights clear. In this workshop, we determine all relevant perspectives and map them clearly, so you can make informed and data-driven decisions.
In the first design-build-integrate cycle, it is not feasible to work out all perspectives at once. Therefore, it is fine to write down 4-8 perspectives, but immediately prioritise (1-3) each.
From experience, we recommend working on one perspective per cycle (±3 months). In some cases, we can start with two perspectives at a time, for instance when finance has already defined clear reporting requirements.
4.3. Key Performance Questions (KPQs):
When is a perspective successful?
For each perspective, discuss what success means and what it looks like.
Duration: 30 min
Formulate success criteria as a question.
These are the so-called KPQs (Key Performance Questions). KPQs are the questions an entrepreneur asks about a perspective within his company. The answer to these questions is embedded in the KPIs (Key Performance Indicators). Make sure you include your list of KPIs, but respect the order: first formulate the question you want answered and then link the relevant KPIs.
Define business value.
How valuable is it to have an answer to this question at any time? For efficiency, this can be calculated in time savings or cost ($), or else in terms of High, Medium or Low (H/M/L).
Define priority.
Rank the perspectives according to their importance and impact for the business.
Be realistic.
Avoid labelling all perspectives as "High" (H). Focus on the most crucial KPIs.
Some examples for inspiration.
Employee: as CEO, I want to know every year:
- How happy our employees are,
- broken down by department,
- So that we can improve our company as a workplace to "Great Place to Work".
Project: as Project Manager, I want to know every month:
- How many hours we need to deliver the following month,
- For each project, broken down by task type
- So that I can plan our capacity and avoid downtime.
4.4. Current reporting
In this part of the workshop, we will take a close look at your existing reporting. Perhaps you already have some Power BI dashboards or a collection of Excel artwork (read Power BI vs Excel) reports that you and your team put together monthly.
Duration: 45 min

Now is the time to add and discuss these reports. Group the Excel files by perspective, such as Sales, Finance or Operations. There is no need to go through every cell in detail. Instead, focus on the KPQs (Key Performance Questions) that this report is trying to answer.
In addition, it is interesting to gain insight into:
- Frequency: How often are these reports currently compiled?
- Time commitment: How much time does the process take?
- Access: Who has access to these reports?
- Responsibility: Who is ultimately responsible for the reports?
By discussing these aspects, we not only gain insight into the content of the reports, but also their operational value for your organisation. This forms the basis for a more efficient and integrated approach with Power BI.
It is also the ideal time to take a critical look at your current reporting: which reports can be discontinued, simplified or merged? No business benefits from a plethora of 50 dashboards. It's all about relevant and clear insights.
4.5. Dashboard design
Duration: 45 min
During this step in the workshop, we focus on the optimal analysis flow of your dashboards. The aim is to provide users with a logical and intuitive way to navigate through the data, where key insights and outliers stand out immediately. Create a wireframe (like the digital version below) to visualise the dashboard layout and make it clear how navigation, KPIs, drilldown and details come together.
Or draw the dashboard big on a whiteboard so that everyone gets a clear and vivid picture of what it will look like!
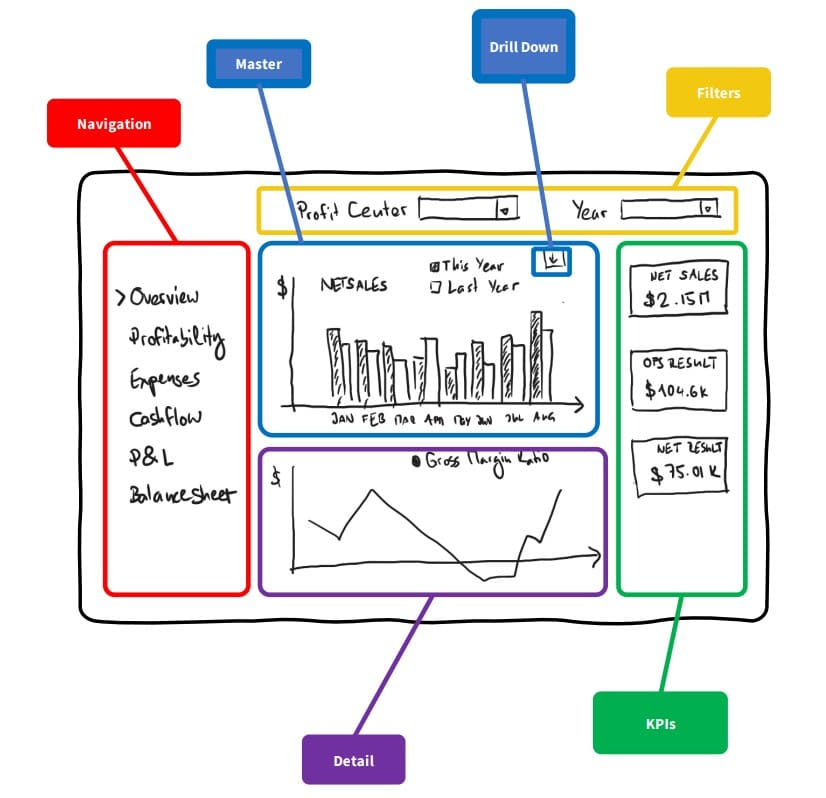
Start with the main navigation
Start your analysis with a clear navigation bar. This provides access to main sections such as:
- Overview
- Profitability
- Expenditure
- Cash flow
- Income statement (P&L)
- Balance sheet
In Power BI, these will be different pages of your dashboard. The navigation bar is then built in by default.
Visualise key KPIs
Ensure that critical KPIs, such as net sales, operating profit, and net income, are prominently displayed. These provide instant insight into your organisation's performance.
Use master and drilldown views
- Master view: Start with a summary, such as net sales per month in a clear chart.
- Drilldown views: enable easy clicking to detailed information, such as turnover per customer or region.
Provide level of detail
Support analysis with detailed visualisations, such as trends in gross margin percentages or other key indicators. These give more context to the KPIs.
Filters for targeted analysis
Add relevant filters, such as date, customers or product category, so users can quickly view specific data.
4.6. Budget
It's time to summarise all the work from the workshop. Briefly go over again step by step what was discussed and estimate the effort needed to implement the plan. Based on this, you can determine when your team can free up the necessary capacity.
At Power Partners, we use a clear and structured process for budget estimates. While we cannot estimate exactly what level of Power BI and data engineering skills are present within your organisation, we provide a transparent explanation of our approach. You can then apply a correction depending on the knowledge and experience within your team.
Data sources
- For an ERP system, we charge on average 7 days of work to link and optimise data sources.
KPIs
- For developing, testing and rolling out KPIs in DAX, you should count on 2-4 hours per KPI.
Dashboards
- For a dashboard, usually consisting of two pages, we estimate 2-3 days of work on average.
Workload calculation
Write down all the requirements and KPIs defined during the workshop. Use the estimates above to calculate how many days of work are needed.
Example:
- 1 ERP resource: 7 days
- 10 KPIs: 10 × 3 hours = 3.75 days
- 2 dashboards: 2 × 2.5 days = 5 days
Total: 15.75 days of work
Realistic Budget for the First Cycle
Based on our experience, a budget of 12-18 days for the first cycle(design - build - integrate) is realistic. In these projects, we expect 25% availability of your team to collaborate and provide feedback.
With this overview, you can make an informed decision on the planning and execution of your Power BI project. The goal is to create value step by step while maximising your organisation's capabilities.

4.7. Next Steps:
Plan a follow-up meeting to gather input from other colleagues or to discuss further steps. Make sure everyone stays involved.
Discuss the estimation for the Power BI project:
- Which key users are needed?
- How do we mitigate risks?
- What is a feasible schedule?
- How does this Power BI project contribute to our overall digitisation?
- Is there an opportunity to apply for grants for this project?
- And above all, what are the expected costs?
Take time to gather feedback on the workshop. What worked well, and what could be improved? Adjust the approach for future sessions, especially if certain comments come back more often.
Need guidance during this workshop?
With these 7 steps, you can work independently to make your Power BI project a success. But we understand that this process can sometimes be challenging. Do you encounter obstacles or want a more structured and professional approach?
Our Power Partners consultants are ready to guide you. From strategic advice to hands-on implementation and training - we help you deploy Power BI optimally within your organisation.
More information about the Power BI workshop?
Leave your e-mail address and get all the details!


