
Let's end this fight once and for all. If your relationship with Power BI is still young, you're probably as intrigued as you are confused. You may have already heard of Power Query and its M language – or you may even have used them in Excel. And then there's DAX. M, DAX, multiple personalities? Why are there multiple programming languages in Power BI? What's the difference? And why is all this so bloody hard?
Don't worry. What is confusing for the novice will quickly become clear and straight forward once your love to Power BI matures. So, what is the difference between M and DAX? In one sentence: M is used for data engineering (sometimes called data prep), and DAX for data analysis.
Not quite clear yet? No problem, let's tender gently. In this article, you will learn step by step what Power Query, M and DAX are, and what to use them for.
What is Power Query M?
Unlike other business intelligence tools, Power BI includes its own data engineering tool. As a result, the advanced business user can even build his own little data warehouse.
Some users are already familiar with Power Query through Excel or other Microsoft tools (e.B. Power Apps, Azure Data Factory, SQL Server Analysis Services, or Dynamics 365 Customer Insights). Of course, if that's you, you'll have a head start.
First and foremost, Power Query is an Extract Transform Load (ETL) tool. It allows us to
- Download and fetch data from different sources. We call this data ingestion
- Combine, clean, and model this data. We call this data wrangling
With its well-arranged graphical user interface, similar to the environment of other Microsoft tools, even you as a beginner will soon be able to perform complex cleanup and formatting transformations, often without having to touch a line of code.
Once you and Power Query have gotten a little closer, you can - by mutual agreement - become more intimate: explore M's dirty little secrets, and you will discover an adult functional programming language.
As convenient as the point-and-click in Power Query is, M opens even more doors, with even more possibilities. One point I really like about Power Query and M is that I can switch between no-code and coding whenever I want.
DAX
DAX, or Data Analysis Expressions, is another programming language in Power BI. It is very different from M and has a completely different use case. DAX is most similar to Microsoft Excel functions. Technically, DAX is not a complete programming language, but a collection of functions and operators.
Users with programming skills find it easier to get started in M than in DAX. The most difficult hurdle at the beginning is to understand that each DAX measure can - and will - refer to different data contexts in the analytical data model. Desperate exclamations in our office are the order of the day: "But what does this thing do? If only I could debug that!"
Currently, more than 250 functions are in use in DAX and the number continues to rise. For an overview, see the Microsoft documentation page.
DAX functions include filters, aggregations, financial functions, mathematical and logical functions, data relationship functions, time and date intelligence, and many more.
You can use DAX functions to create measures and calculated columns. Measures are dynamic calculation formulas in which the results change depending on the context. Contrarily to calculated columns, measures do not calculate values for each row. Instead, they return aggregated values from a set of rows (called context). They are extremely useful for data visualization and data analysis.
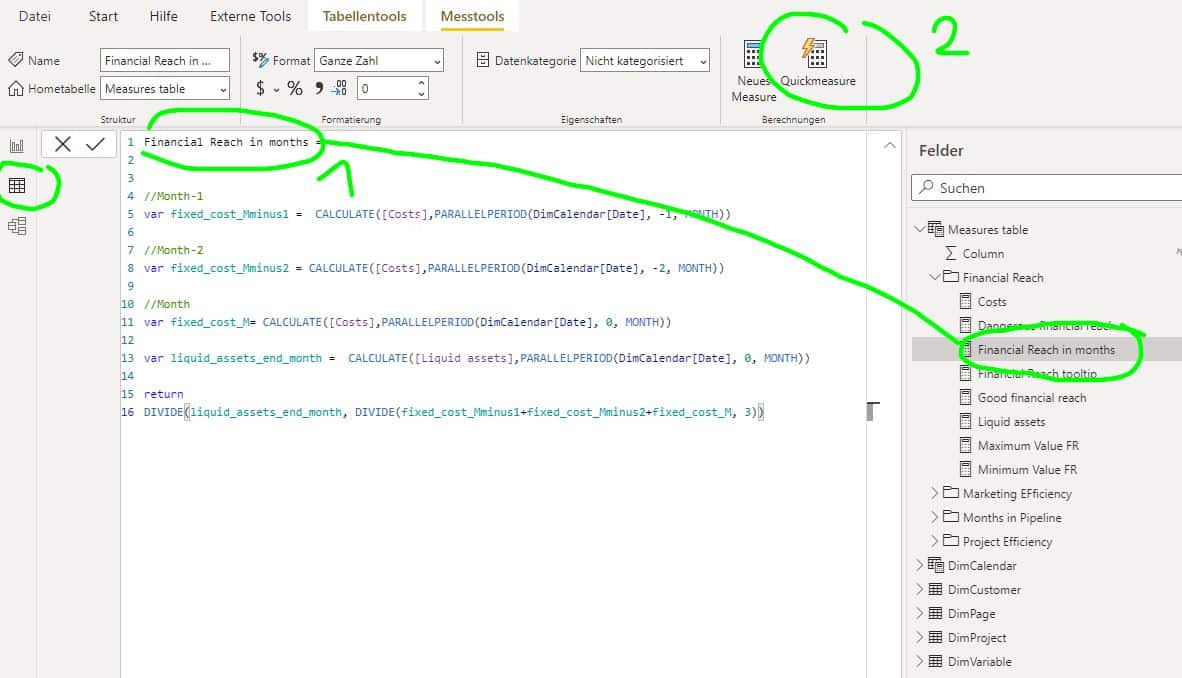
My recommendation for the beginner: Whenever possible, use the Quick Measure functions, which provide a point-and-click definition of commonly used DAX operations such as sum, mininum, maximum, etc. Quickmeasures in Power BI are irreplaceable both as reference and learning tool, but as well as a starting point for more complex measures.
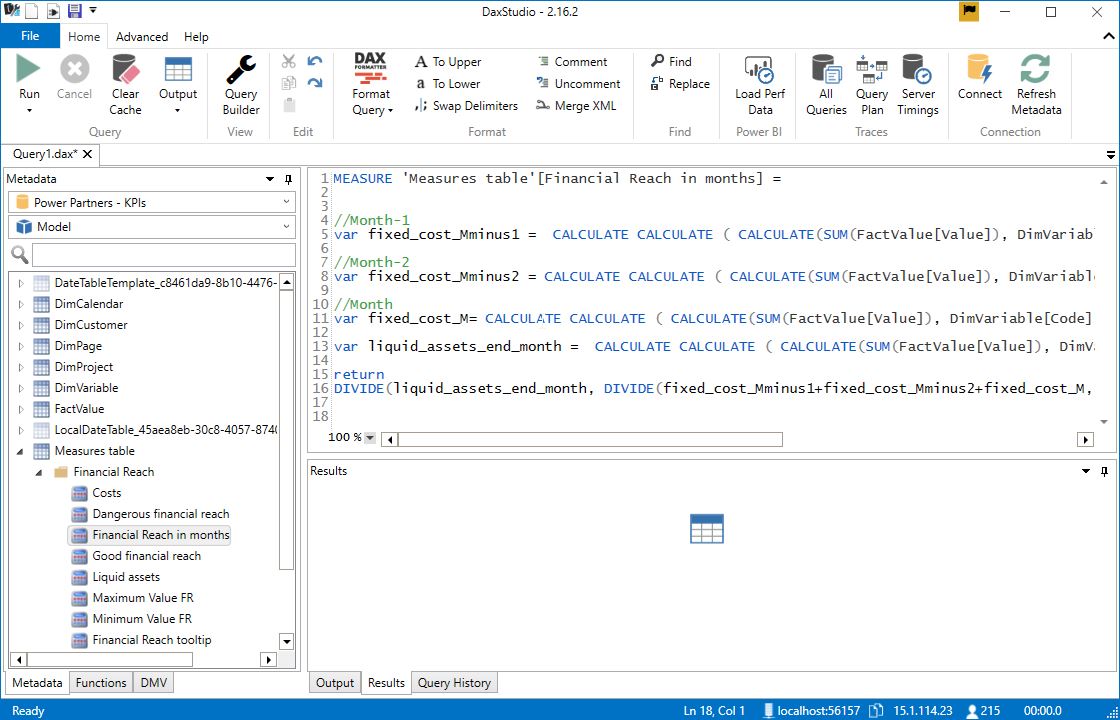
And while we're at it, here's another recommendation: By all means learn DAX Studio as early as possible. It is a truly irreplaceable tool!
When do I use M, and when do I use DAX?
In computer science, just as in many other fields, the following axiom usually applies: Many paths lead to Rome. In Power BI, this is especially true. The difficulty is to learn when it is best to use one tool over the other.
For example, you can do a calculation, an aggregation, as well as filtering in both M (i.e. in data engineering) and in DAX (i.e. in data analysis).
At Power Partners, we defined clear rules regarding the usage of DAX and M. This makes easier for new employees to get started, and it simplifies communication among the team members.
Power Query
Power Query / M is used for data engineering, so:
- Data Ingestion: Power Query allows you to import, combine, and update data from various sources (e.B. from a local folder, SharePoint, Database, API, Azure, and many more).
- ETL and ELT processes: Extract – Transform – Load, and Extract – Load – Transform are the two approaches to data processing. For both, Power Query is the tool of the hour.
- Data Wrangling: The data is then cleaned and transformed. Joins are made, filtered, uniform names are assigned, unnecessary columns are removed, etc.
The following rules apply:
- Data sets that we will never need in data analysis are filtered in M
- We do not aggregate records into M
- Columns that we never need are removed in M
- We do not do calculations in M
Exceptions confirm the rule. For example, there are situations where a calculation in M is much easier to accomplish. Or, sometimes we are facing huge amounts of data, such that aggregation in M saves us a fair amount of trouble down the road.
DAX
DAX is used for data analysis, so:
- Aggregations: If you need to retrieve aggregated values from a table or dataset, then the best and fastest way to do so is with DAX aggregate functions.
- Filtering: In measures, filtering functions are among the most commonly used. They help to filter only the relevant information and/or edit the data context to create dynamic calculations without changing the data model and its tables. This is important for visualizing and aggregating specific values for reports and dashboards and other calculations using these filter metrics.
- Define relationships: Power Query knows no relations. In DAX, on the other hand, you can define and change relationships, but also enforce them using referential integrity.
- Relationship functions (hierarchies). DAX contains functions to return e.g. the cardinality of relations and records.
- Calculated column that references a column from another table. With DAX, the user can easily insert columns from different tables into the formula. In Power Query, this maneuver requires complex joining and becomes complicated very quickly.
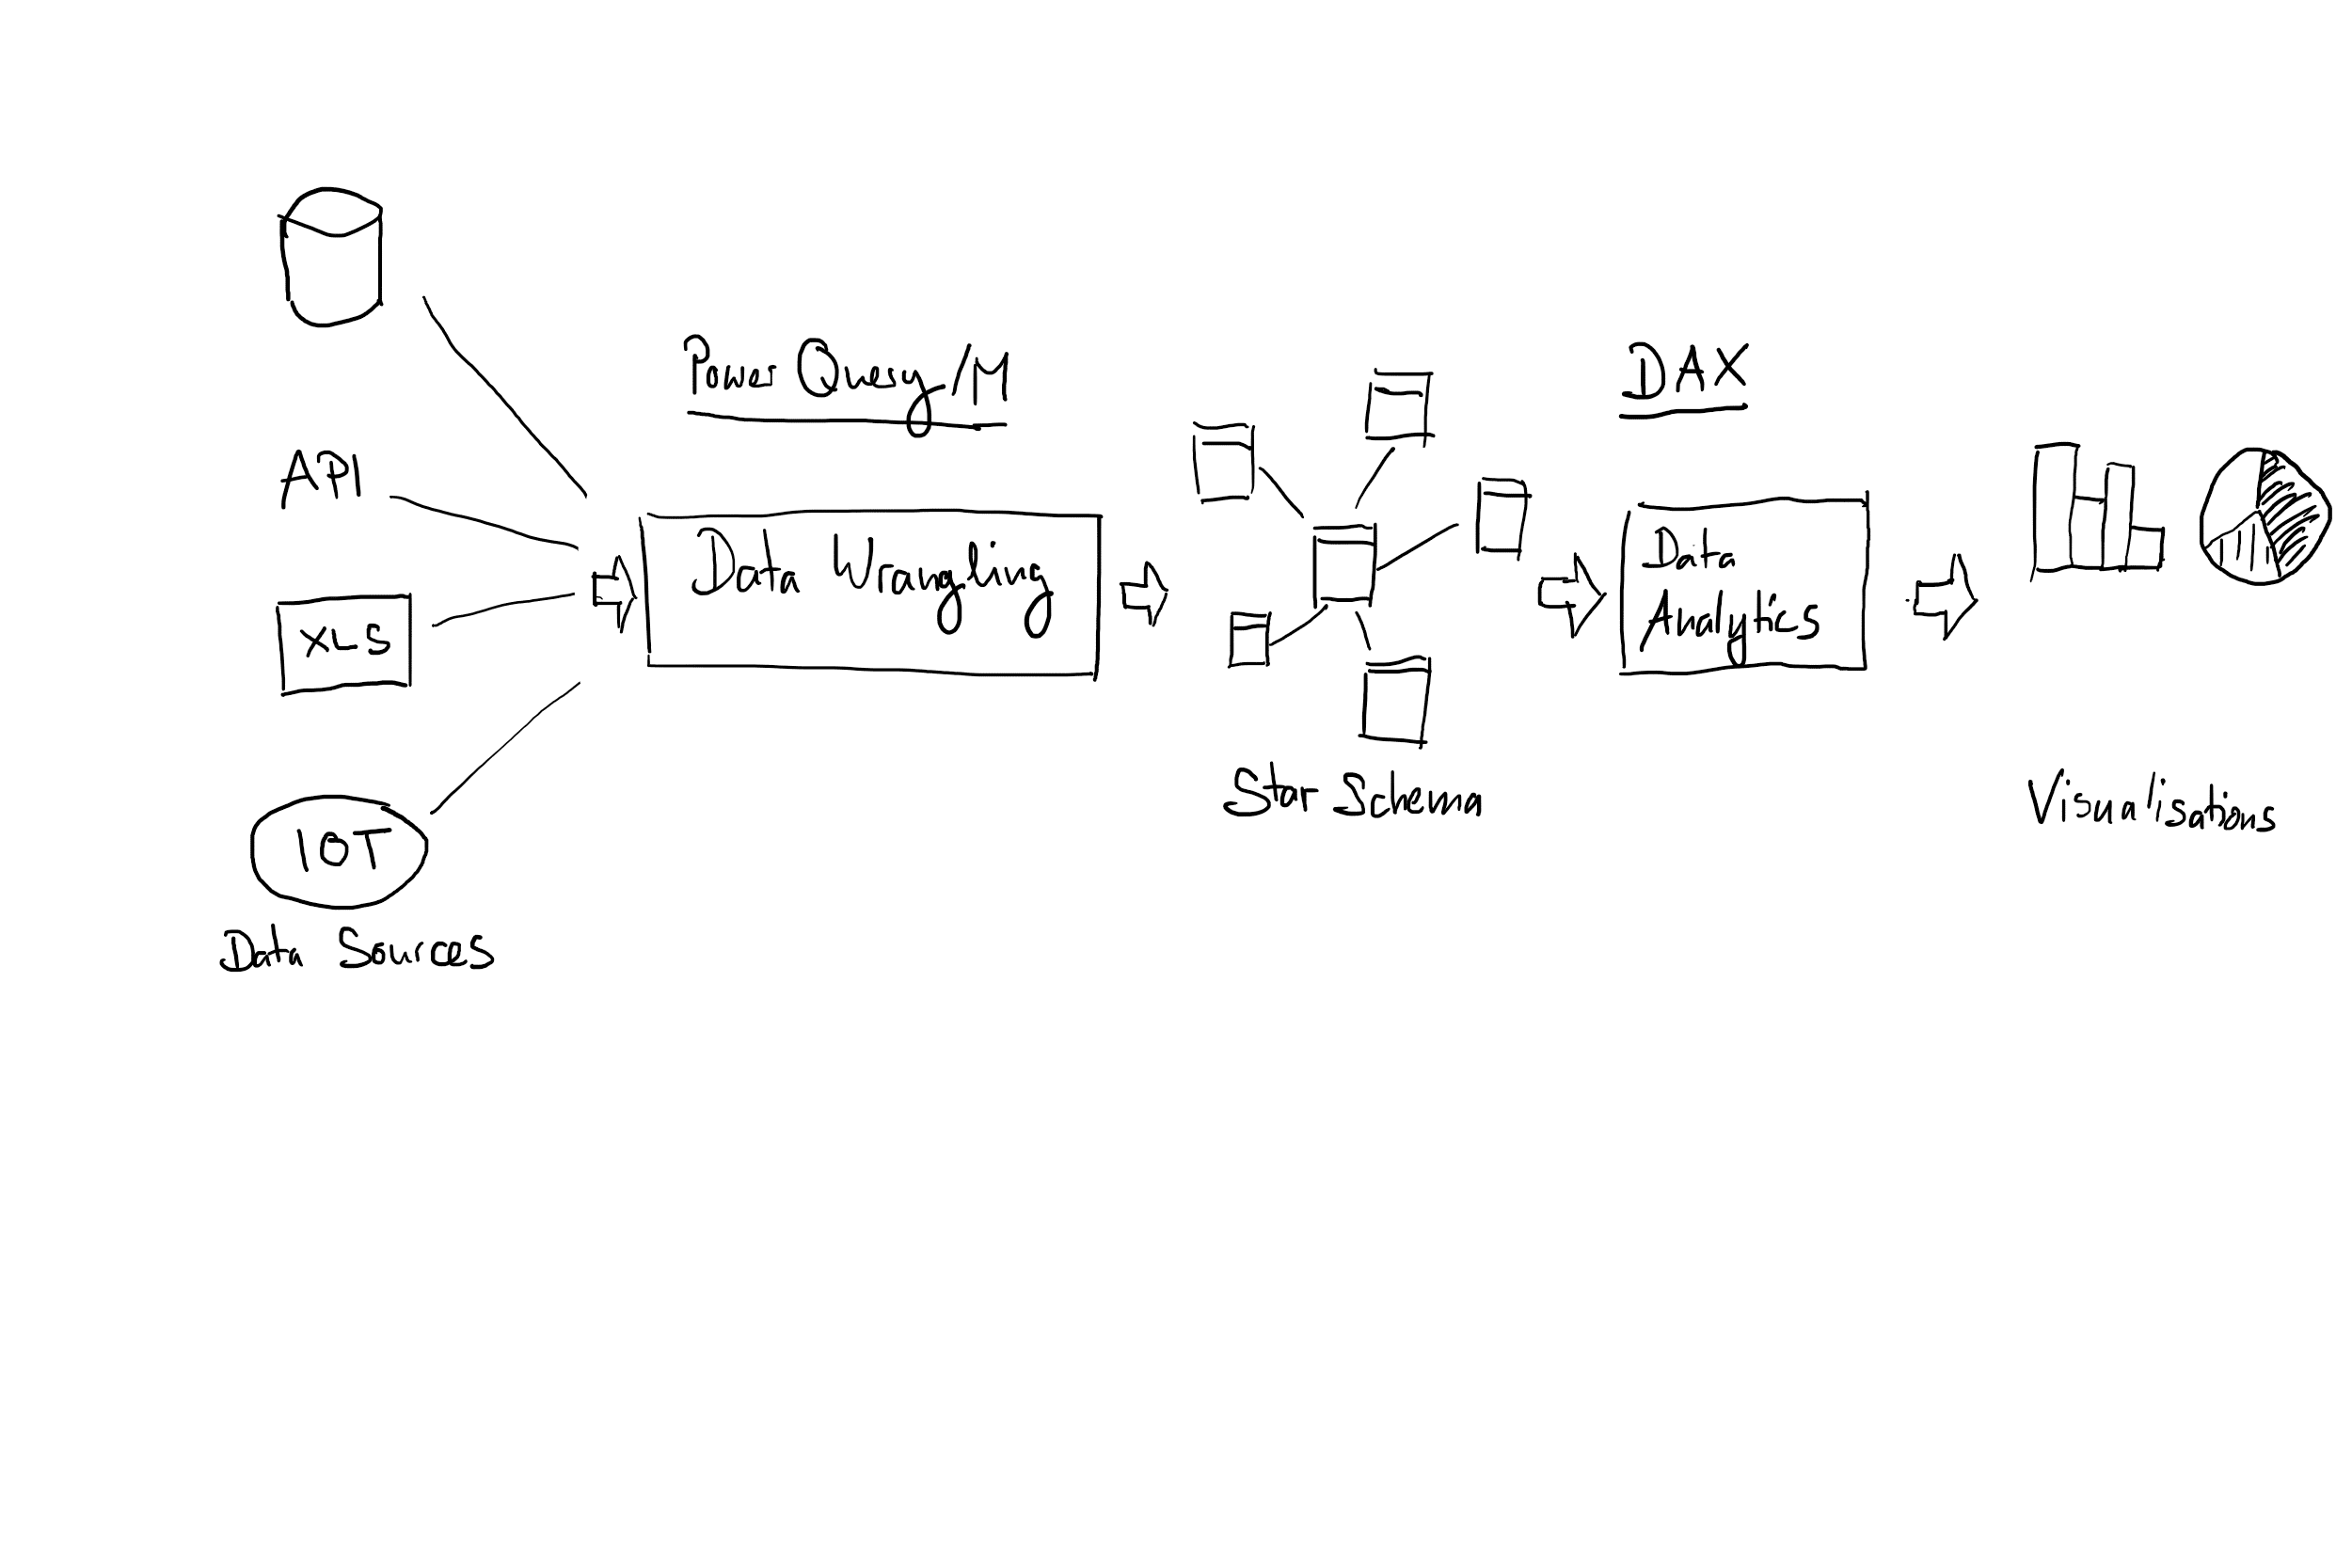
A blueprint for a Power BI data process
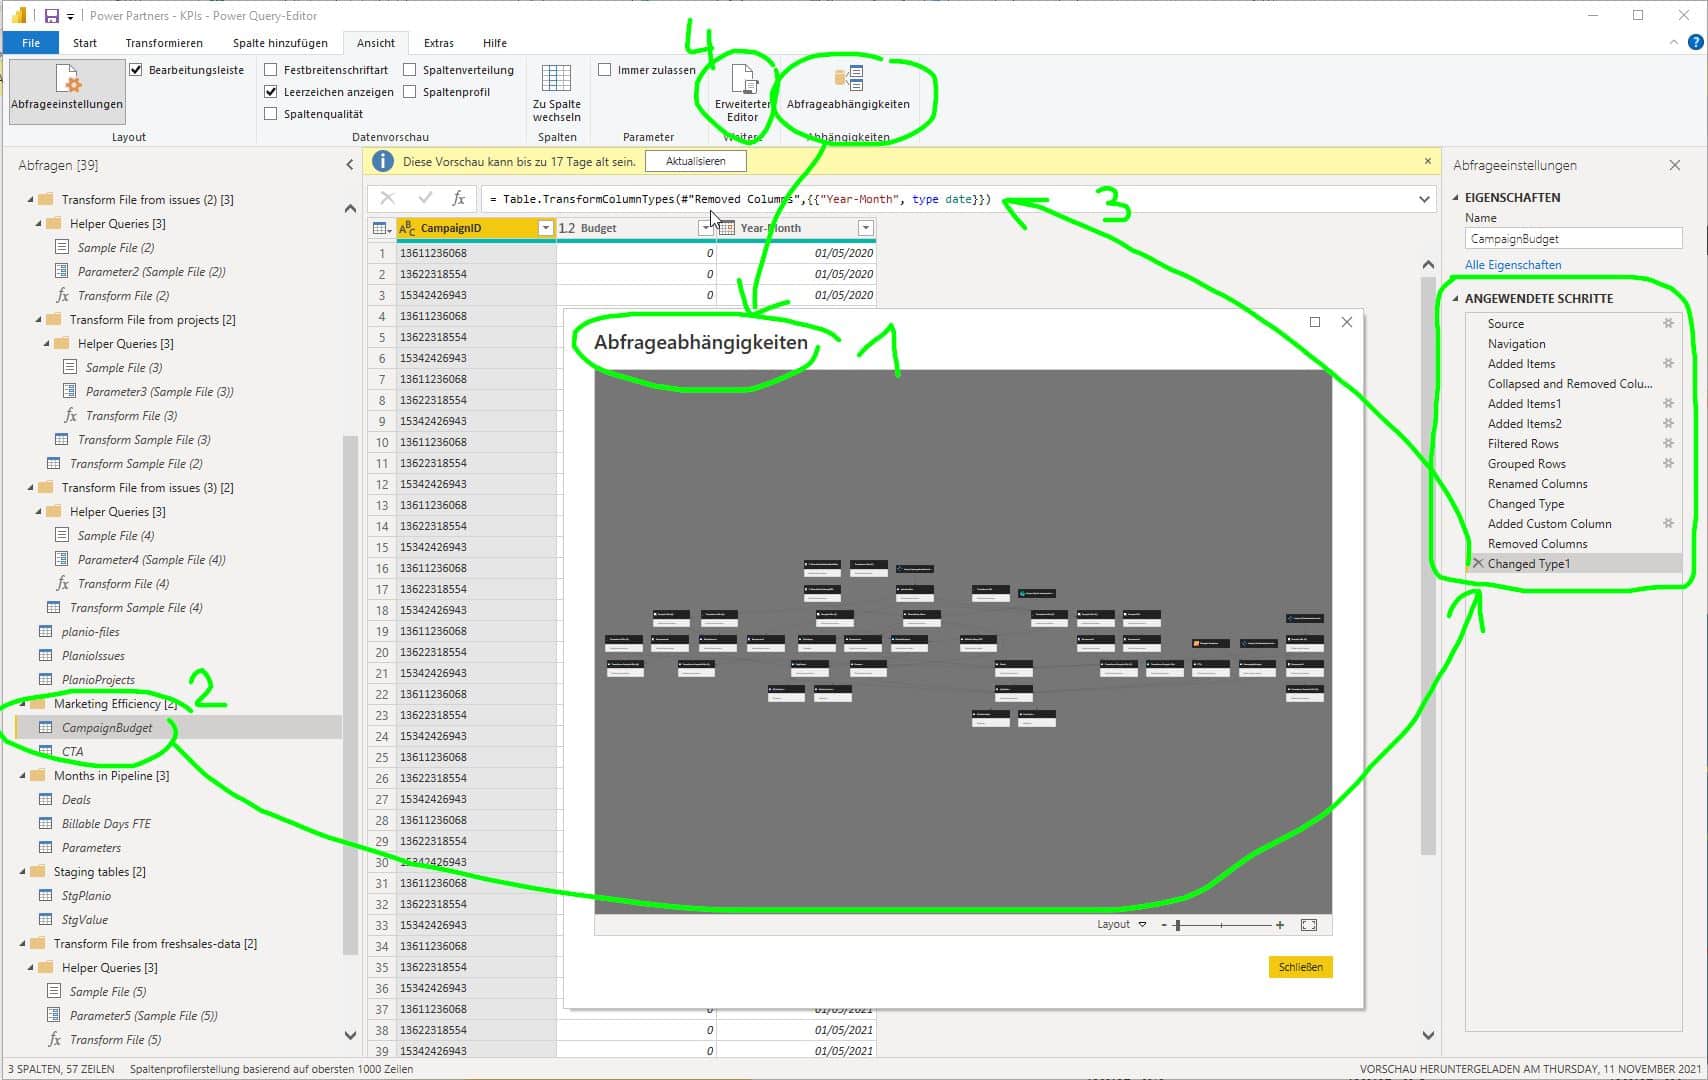
Our first steps are always done in the Power Query Editor, where we collect data from different sources, clean and format the data.
DAX only comes into play in the second step, in data analysis. We primarily calculate measures and KPIs, and and use DAX to filter for the visualization at hand.
Conclusion
In summary, we always start in the Power Query editor. With the graphical user interface and M language, beginners and advanced users can prepare the data for further analysis and visualization.
DAX, on the other hand, is used in a second stage, to make calculations from several records, and to aggregate facts individually.
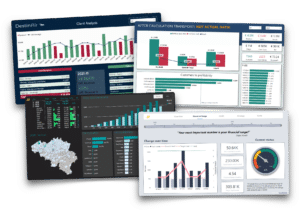
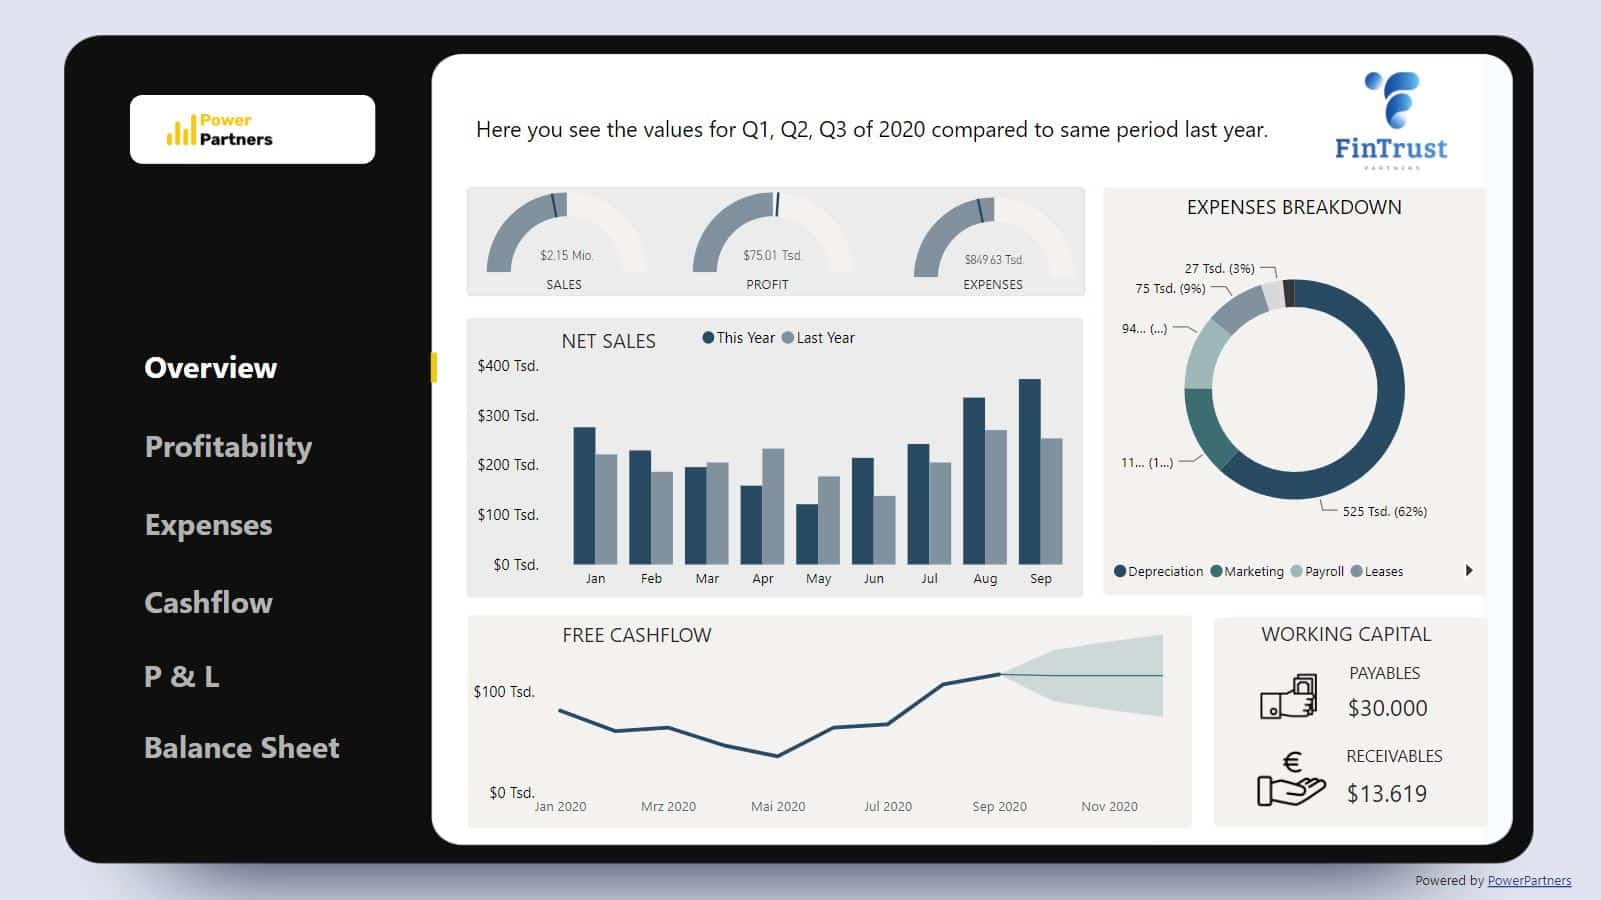
Download our
dashboard portfolio.
Learn how BI can help your company.
✔ Management dashboards
✔ Financial KPIs
✔ Power BI examples
✔ Free advice


