As an entrepreneur, how do you make decisions? From the gut? Because you are forced? Forced by your employees, by your bank, by your customers, by your supplier? Or do you decide without realizing it, namely passively by brooding, brooding and not deciding? At Power Partners, we need four simple metrics. Since we introduced them, I can always see where we stand. I know what bottlenecks we have at the moment. And everyone in the team knows what our goals are and where there is a need for action. Find out which KPIs these are. And learn how you too can bring light into the darkness by supplementing your entrepreneurial intuition with KPIs. But the best of this Dashboard of the Month comes last. At the very end there is a special offer that you should not miss!
- Title: Core KPIs
- Customer: Power Partners
- Budget: 6 days
- Data sources: Freshsales, Planio, bexio, Google Ads, Google Analytics
Content
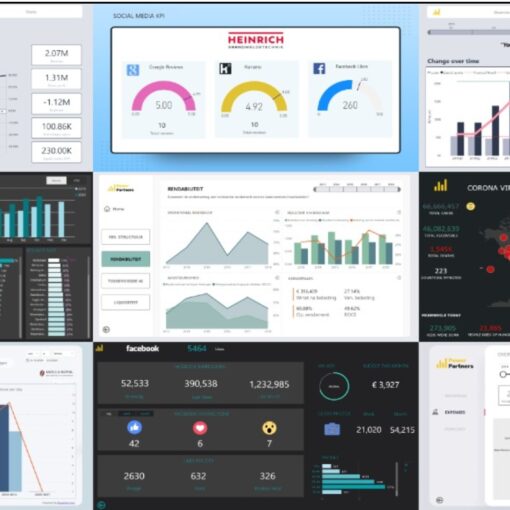
Dashboard (for the impatient reader)
Note: As always, this dashboard does not show any real data, but data from our fictitious example company DestinAir, an airline that offers adventure excursions. She has a CEO (Leo Barth), a logo, and who knows, maybe soon her own website!
So, the first curiosity could hopefully be satisfied, and after this announcement and the interactive dashboard, you have regained the necessary peace to include some background information in the following info block, which we have compiled for you:
KPI: What is it?
KPI stands for Key Performance Indicator. On German, this is often translated as a key figure. Sometimes you can also see the terms key performance indicator, metric, and more. We do not want to start a debate about terminology here. But for understanding, it is helpful if we define very briefly how we use these terms at Power Partners:
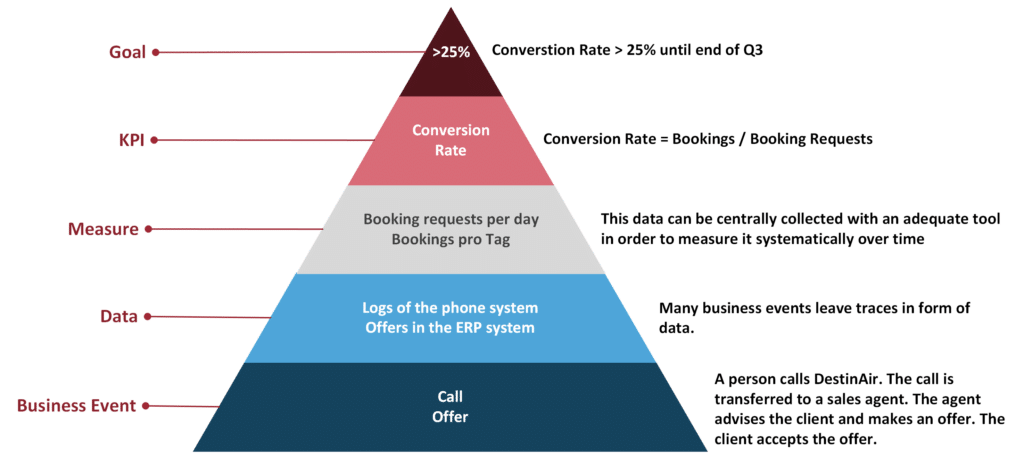
Transaction
- "Something happens" in or around our company: a person enters our business, a customer signs a contract, an electricity bill flutters in.
- We are generous in defining the business transaction: Every potentially measurable quantity is a business transaction for us.
- Many business transactions are not measured. Or do you know how many coffees you draw every day?
Data
- Some (but by no means all) business transactions leave traces in the form of data.
- A lot of data is never evaluated and dies a lonely death in the deepest depths of the directory structure of an obscure server in a remote data center
Measure
- a metric is a measured and systematically evaluated quantity based on data from a specific business event type
- Typical examples of metrics e.g number of clicks, profit, number of employees, number of sick days, etc.
- Often metrics are absolute variables (i.e. "number ...") and cannot be compared over time or between companies.
- Usually, metrics are measured as time series (e.g clicks per day, sick days per month, profit per quarter, etc.).
Key figure (KPI):
- We use both terms key figure and KPI interchangeably.
- As a key figure, we refer to a metric that has strategic significance. A key figure therefore always belongs to a goal - or even better: a key figure measures the extent to which we have achieved a goal.
- Often, KPIs are expressed as a ratio, rate, or quota of multiple metrics. This allows them to be compared over time or between several companies.
- In addition, each key figure also includes a scale. This scale expresses what is a bad, an acceptable one, and what is a good value or target corridor for the metric. But the scale also defines minimum and maximum values.
- There are a large number of different ways to design KPIs. Sometimes a negative value means that the key figure is in an unfavorable range, whereas a positive number indicates a favorable development (e.g. return). But sometimes KPIs also go from 0 to 1. Or from 0 to infinity.
- KPIs are often designed in such a way that a larger value also indicates a more favorable location. But it is often also the case that we aim for a certain target value with a certain KPI, so that a value that is too low, but also too high a value is bad.
Goal
- At Power Partners, we always focus on goals that are SMART, i.e. specific, measurable and timed.
- By defining a goal based on a metric, we ensure that it is specific and measurable.
- A typical goal would be: By the end of the year, we want to have a financial reach of 6 months.
Visually, you can present it like this:
KPI: The Big Four
We use the following 4 KPIs at Power Partners and use them again and again with our customers.
We believe that these four KPIs are relevant for many companies, regardless of the size of the company, the capital structure or the sector. That's why we call them "The Big Four." Admittedly, for some customers one or the other does not fit, or we have to adjust one of the key figures a bit.
And here they are, the Big Four:
- Financial reach
- Project Efficiency
- Marketing Efficiency
- Months-in-the-pipeline
Financial reach
A lot has been written about the financial reach - in this blog and elsewhere. Some may remember that last year we offered our readers and customers a free financial reach dashboard during the corona crisis. By the way, the offer is still valid, please contact mailto:[email protected] if you are interested.
KPI Type
Finance, Liquidity
Description
The financial reach answers the question: Given my fixed costs and my liquid reserves and open credit lines, how many months can my company survive if the worst possible case occurs.
The worst possible case for any company is: All open invoices are not paid, all customers jump off, no new customers come. If this happens, then I continue to pay my fixed costs, against which no more money comes in. How long can I continue? That depends on how large my reserves are in the form of liquid funds and open credit lines.
Definition of financial reach
Financial reach in months = cash / fixed costs
whereby:
Cash = Cash and cash equivalents + open credit lines
Fixed costs = Average monthly fixed costs over the last 3 months
In the original definition of financial reach, an average of 6 months is expected. However, we have learned from our consulting work that three months are more helpful, especially for young and growing companies, as the costs often grow quickly and would therefore be underestimated with a sliding average of 6 months.
Scale
The Financial Reach KPI can go from 0 to infinity. Values between 6 and 18 are good. If the value is lower than 6, I take a big risk. If the value is higher than 18, I have an unnecessary amount of liquidity lying around that I could possibly invest better (inside or outside the company). But we've never seen a company where the problem was too much financial reach.
Concrete:
- Red: A value of < 3 ist hochriskant.
- Orange: A value of 3 - 6 is risky.
- Green: A value of 6 - 18 is ideal.
- Orange: A value of 18 - 24 tends to be inefficient.
- Red: A value of > 24 is inefficient.
Interpretation
The financial reach indicates how many months I would have in the worst case to either develop a new business model or to shut down my company.
Example
Let's say DestinAir has the following fixed costs (personnel costs, rental costs, leasing installments, etc., but without kerosene, entry fees, etc.)
- January: 500'000
- February: 550'000
- March: 600'000
Let's further assume that at the end of March DestinAir has cash and investments with a short-term maturity of 1.4 million, as well as an open credit line of 0.5 million (excluding receivables).
The financial reach is then:
Financial Reach = 1.9 / (0.5+0.55+0.6)/3 = 3.5
In the worst case, the company could therefore maintain operations for 3.5 months, pay wages, meet demands. DestinAir would therefore only have 3.5 months to lay off the employees, sell aircrafts and take-off licenses, etc.
Not yet subscribed?
Have you already subscribed to our monthly newsletter, Dashboard of the Month? Month after month, we present a dashboard and share insight on how our customers design smart KPIs, how they set their goals, and how they make sure they reach them by tracking progress in a Power BI dashboard. Not to miss!
Project Efficiency
This KPI from the field of project controlling is helpful for all companies that perform work at fixed prices. Among them are many craftsmen, IT service providers, event organizers, mechanical engineers, architects, garage owners, and many more. In a slightly modified form, however, this KPI is also relevant as a production efficiency for manufacturing companies.
KPI Type
Operational efficiency
Description
With this KPI, we want to measure how efficiently our team performs its work compared to its estimates. If we predict perfectly, then we are like a Swiss Clockwork. Things become plannable, which is good regardless of whether our team is working fast or slow.
If we regularly need more time than planned (and invoiced) for the implementation of projects or the production of goods, then we have two options:
- We can increase our estimates (e.g. by training our team better, or by spending more time and detail, or simply by applying a contingency factor to the estimates)
- Or we can work towards making our team work more efficiently (hire more senior staff, training, or by using a better method, or using better tools, etc.)
Definition of project efficiency
Project Efficiency = Estimated Effort / Actual Effort
whereby:
Estimated Effort = sum of the estimated effort in hours of all projects completed this month
Actual Effort = sum of the actual effort in hours of all projects completed this month
By only considering the projects (or products) that were completed during the measurement period, we add a delay to the metric, which makes the KPI more backward-looking. On the other hand, this avoids complicated adjustments for half-finished projects. For short projects or high quantities, this is negligible. However, for long projects, where a single project can occupy the whole team for several months, this KPI must be adjusted.
Scale
The Project Efficiency can go from 0 to infinity.
Ideally, the Project Efficiency is 1 or slightly above.
Interpretation
If the KPI is lower than 1, the actual effort is greater than the estimate. So we are not implementing our projects profitably.
If the value is too high, i.e. significantly above 1, we systematically overestimate the effort. There are two possible consequences of this:
- Either we charge our customers too much for our service. We risk losing market share.
- Or the unit price for our service is set too low. Estimating fewer hours at a higher internal hourly rate is then the way to go.
If the Project-Efficiency is stable (but consistently wrong), we can adjust the estimates with a factor.
The worst situation is if the Project-Efficiency is fluctuating a lot from month to month. In that case, our team is just bad at estimating, and there is lots of unpredictability in our business. And we hate unpredictability.
Example
Let's say DestinAir offers other airlines to carry out aircraft maintenance. This service is offered at a flat rate depending on the type of aircraft, whereby the spare parts are charged extra.
Let's say in March, DestinAir carried out three such projects. The numbers are:
| Aircraft A | Aircraft B | Airplane C | |
| Estimated effort | 10 | 8 | 12 |
| Actual effort | 8 | 9 | 16 |
So the project efficiency is:
Project efficiency = (10 + 8 + 12) / (8 + 9 + 16) = 30 / 33 = 0.9
Accordingly, Leo Barth, CEO of DestinAir, has the following options:
- make the team more efficient
- increase the estimated efforts going forward and charge a higher price for the service
- Increase the estimated effort but pay the team less
- no longer offer this type of service for all or some of the aircrafts.
Marketing Efficiency
KPI Type
Marketing
Description
According to us, the goal of any business has to be the following: to become a marketing machine. Every Euro we put into this machine must return more than one Euro in profit.
Once we have built such a machine, we can accelerate or throttle our marketing machine as we want. How fast we want the machine to go will be a function of our delivery capacity. And the marketing budget is not a number that we determine in the beginning of the year by holding a finger into the air. Instead, ist's just a result of adjusting our marketing to our capacity.
We originally developed this KPI for online advertising. But it works for all kinds of campaign-driven advertising, including print and guerrilla tactics. There is one type of marketing, however, for which this doesn't work: branding. But branding is hopefully not relevant to your business anyway. Except if you happen to be CEO of Coca Cola or Nike. In this case, you are welcome to skip this KPI and call our sales department in the mean time: +41 44 500 60 30.
Definition of Marketing Efficiency
Marketing Efficiency = Total CTA Value / Total Campaign Budget
whereby:
Total CTA Value = Sum(CTA Event Count * CTA Value)
Total Campaign Budget = Sum(Campaign Budgets)
whereby:
CTA = call-to-action, i.e. a desired action that the customer should perform (checkout in the webstore, booking a trip, a call to our sales line, redeeming a voucher, etc.)
CTA Event = The customer (or lead) performs the desired action
CTA Value = the value we attach to the CTA Event. In the case of a business transaction, this is usually the profit that arises from the purchase. In online marketing, we value a CTA Event by verifying empirically how often an Event lead to a transaction.
Scale
This measure can take values between 0 and infinity.
A value below 1 is bad: we burn money. This should only be the case temporarily.
Interpretation
In practice, values above 1.5 are rarely reached. And if you do, then you are either a genius, or you overestimate the CTA Value.
Even more than the absolute value, however, we are interested in the development. In our experience, marketing is always iterative. Also at Power Partners we test wether our marketing strategy works by performing targeted, systematic experiments. We measure success compared to the previous experiment, usually maintaining the CTA Event and CTA Value to meaningfully compare iterations among each other.
Example
Let's say DestinAir's marketing strategy consists of two channels: Facebook advertising and an advertisement in a printed travel magazine. The print ad includes a 20% coupon for your next trip.
Let's say in March, DestinAir carried out three such projects. The numbers are:
| Travel Magazine | ||
| CTA Event | 30 customers booked a trip after clicking on Facebook | 23 customers booked a trip with the voucher |
| CTA Value | 250 EUR (the average profit of a trip booked through Facebook) | 75 EUR (the average profit of a trip booked with a coupon) |
| Campaign Budget | In March, DestinAir spent EUR 6000 on Facebook advertising | 2100 EUR for the advertisement in the travel magazine |
So the marketing efficiency is:
Marketing Efficiency = (30*250 + 27*75) / (6000 + 2100) = 1.18
The nice thing about this key figure is that it can also be calculated individually for each channel (Facebook, travel magazine). This allows us to compare the different channels.
Marketing Efficiency Facebook = (30*250) / 6000 = 1.25
Marketing Efficiency Travel Magazine = (27*75) / 2100 = 0.96
So, print advertising burns money, and Leo Barth, the CEO of DestinAir, should think carefully about whether he wants to continue to run the ad in the travel magazine.
Months-in-pipeline
As described here, the KPI is especially helpful for companies that cannot scale up and down their capacity very quickly. These are, for example, most service providers. But manufacturing companies also suffer from the same problem. In a slightly modified form, this KPI can also be applied to these companies.
KPI Type
Capacity Planning
Description
The vast majority of companies depend on capacities. Especially for agencies and project service providers, one of the main difficulties is to manage the size of the project team. Recruiting and personnel selection are time-consuming. So is the training of new team members.
If our capacity is too high, we are unprofitable. Our employees sit around idle, waiting for work, at best.
If our capacity is too low, we will not deliver the promised projects on time. Our customers are dissatisfied, and the future is dark.
Definition of marketing efficiency
Months-in-Pipeline = Pipeline Days / Capacity-per-Month
whereby:
Pipeline Days = Expected Value(Stage Probability, Project Days)
Capacity-per-Month = FTE * Average(Billable-Days-per-Full-Time-Employee)
whereby:
Stage Probability = The probability of a stage in the sales pipeline leading to a conclusion
FTE = full-time equivalent, i.e. the number of full-time positions in the team
Scale
The scale depends on the economic sector, on the culture of your company, on the expectations of your customers.
For Power Partners, we are aiming for a value of 2-3 months.
Interpretation
The KPI indicates how much new business can be expected from our sales pipeline.
If the value is too low, we have to accelerate the marketing machine, or reduce the team size.
If the value is too high, we need to actively manage customer expectations. But we also need to reduce marketing budget and think about hiring new staff.
All of these possible actions have a different temporal component. Capacity is rarely a chewing gum machine in which you only need to insert a coin, and out runs an offshore team starting to work off tasks cheaply and competently. This illustrates once more that this KPI cannot be followed blindly. On the contrary, it takes a lot of management experience to assess what the appropriate plan of action is to keep the value in balance.
Example
Again, let's say DestinAir offers aircraft maintenance at a flat rate.
In addition, we assume that DestinAir's sales team maintains the following sales pipeline:
| Pipeline Stage | Probability of completion | Number of project days per maintenance order | Number of deals in the pipeline |
| Contacted | 3% | 10 | 40 |
| Interested | 20% | 10 | 32 |
| Offered | 40% | 12 (depending on actual offers) | 18 |
| Accepted | 80% | 11 | 11 |
| Prepaid | 100% | 9 | 7 |
The expected value of the pipeline days is therefore:
Pipeline days = 3%*10*40+20%*10*32+40%*12*18+80%*11*11+100%*9*7=322
The maintenance department of DestinAir has 10 employees. On average, an employee of this department can provide paid maintenance of 15 days per month (the rest he is on vacation, in training, sick, does admin and sales, etc.)
Consequently, the capacity of our team is:
Capacity-per-Month = FTE * Average(Billable-Days-per-Full-Time-Employee) = 10*15=150
So:
Months-in-Pipeline = 322/150 = 2.15
The current team needs a good 2 months to process the deals in the sales pipeline.
Leo Barth is satisfied. However, if the value drops below 2, he will become nervous and will want to understand: What is the cause, what measure can we take?
The Dashboard
The dashboard is designed according to the Power Partners design principles:
Dashboard:
The overview page allows you to see at a glance whether a value is getting out of hand:
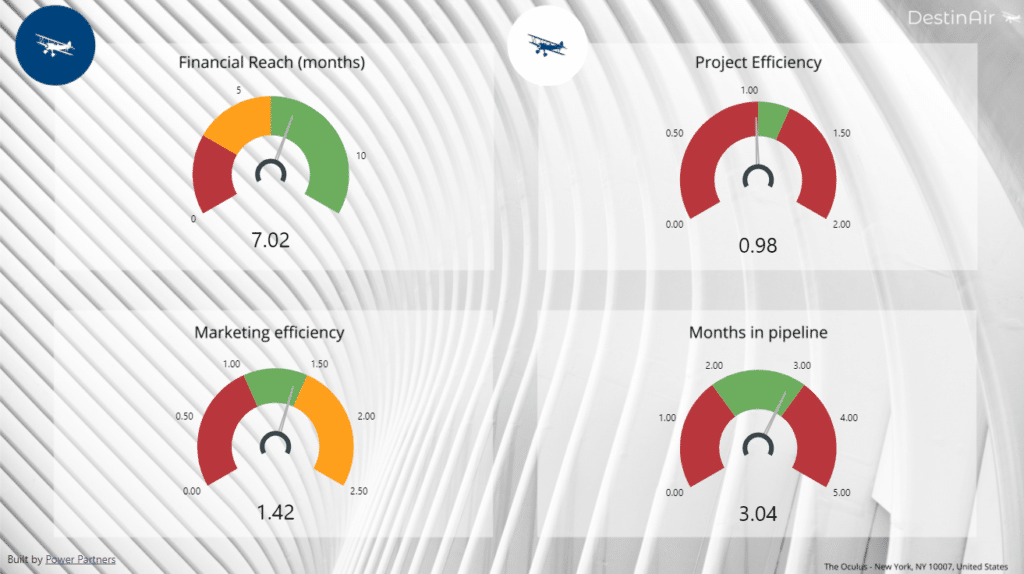
A click on the respective speedometer then allows you to explore the details, the causes, as well as the historical evolution of the KPI.
Financial Reach
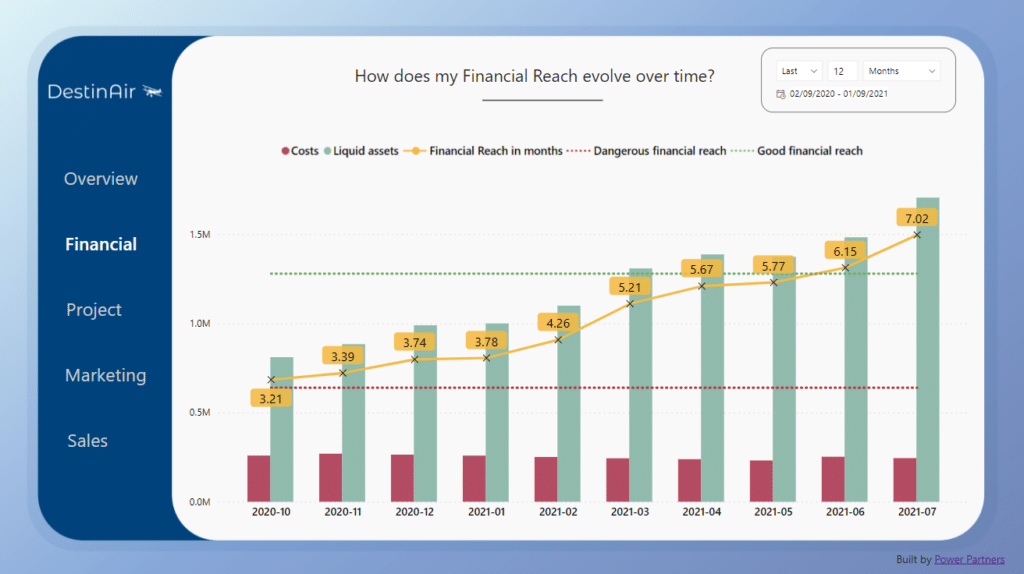
The financial reach has developed well in recent months. Leo Barth is satisfied, because he has made sure that the profit increases while costs remain the same. Now he can finally sleep soundly again. Bravo!
Project Efficiency
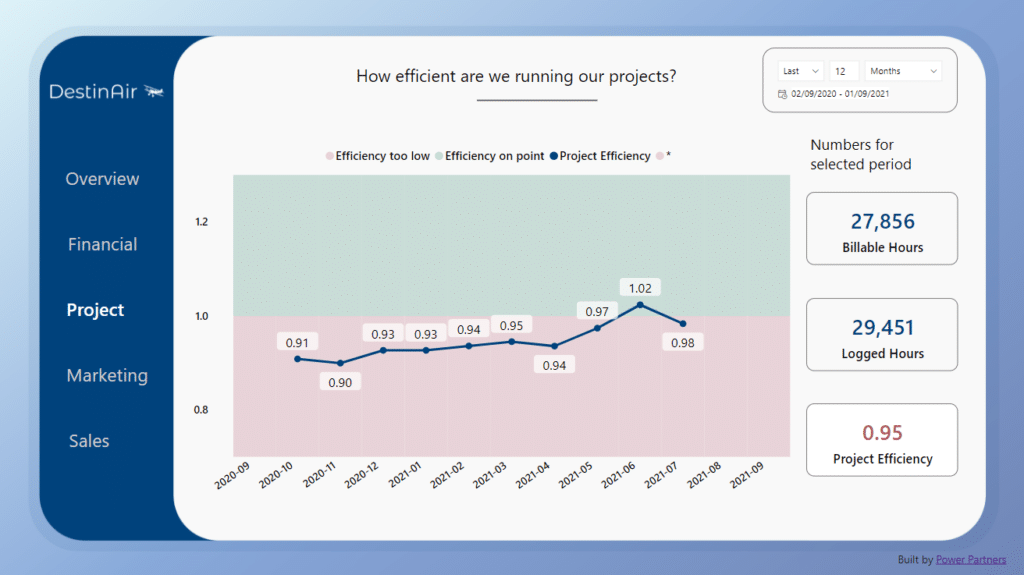
Project efficiency is Leo Barth's problem child. For a long time, he has been trying to increase the estimation accuracy of his team, and for long stretches he succeeds. In the spring of 2020, he introduced a new method that used gameification to increase estimation accuracy. Unfortunately, however, it was not enough.
In early 2021, the project managers were trained again. But the improvements in the KPI were undone by the increase in the size of the team in the spring. Only the application of a factor to increase the estimates showed the desired effect. Whether this development is sustainable remains to be seen.
Marketing Efficiency
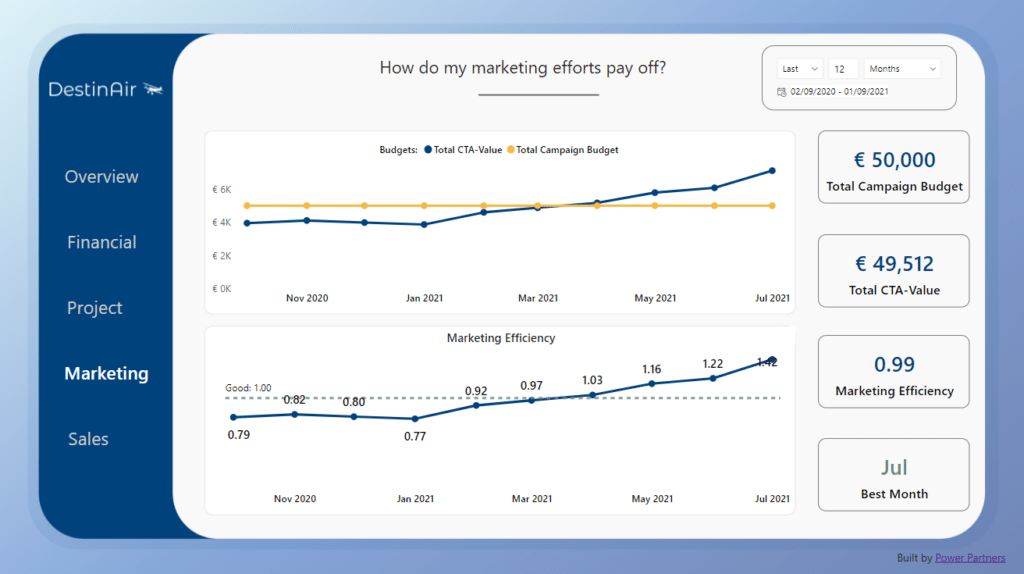
When Leo Barth started systematically tracking marketing efficiency in early 2020, he was shocked at how inefficient his marketing was. Hundreds of euros thrown out the window every month. But then the marketing team started to work systematically on marketing efficiency.
Twice so far, the marketing budget has been increased. In hindsight, however, Leo realizes that this was probably too early: with a marketing efficiency of less than 1, it's not worth increasing the budget. But now that DestinAir regularly has a marketing efficiency of over 1, Leo can start to manage the marketing budget in line with the sales pipeline.
Months in Pipeline
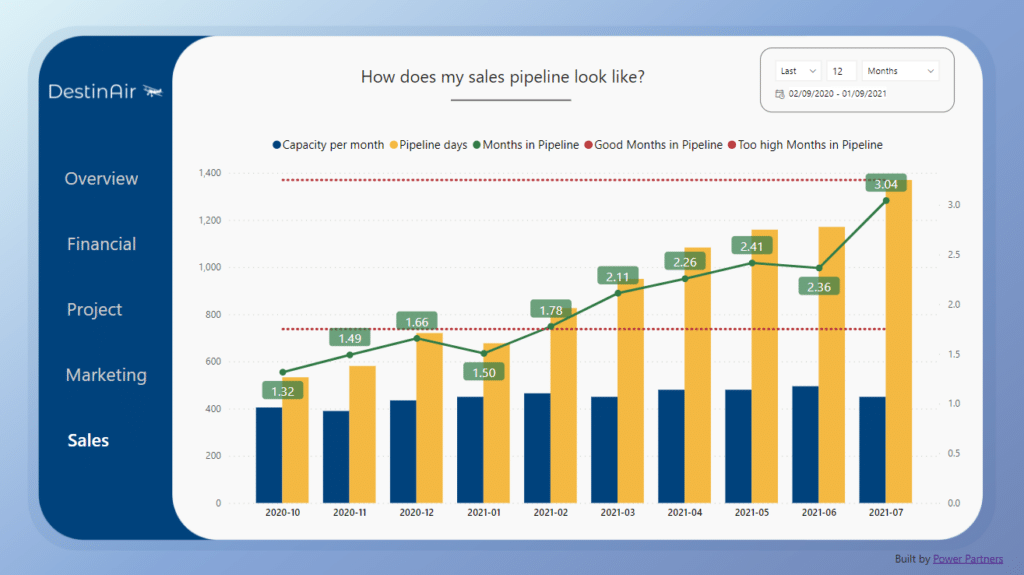
In the early summer of 2020, Leo Barth hired a new sales manager, and he did a great job. Within two months, the pipeline was filled. However, in the fall, the demand then decreased due to seasonal factors. Then, through clever marketing and a high quality of service, the pipeline days could be continuously expanded with a steady but careful increase in capacity.
In July 2021, the upper range of the target band was exceeded for the first time. Leo Barth therefore decided to reduce marketing activities and inform new customers that there could be delays with maintenance work at best.
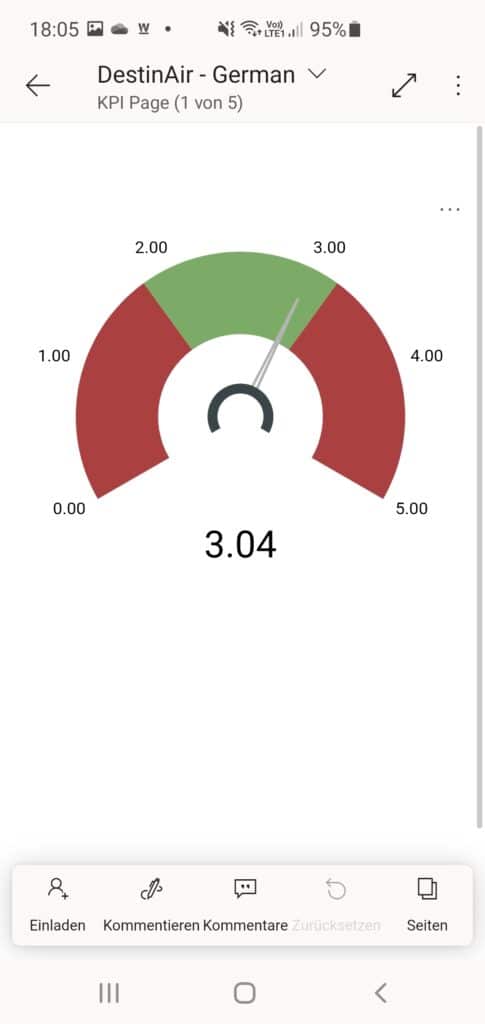
Smartphone View:
The overview with the KPIs can also be displayed on the cell phone of Leo Barth and the entire management. For example, for the months in pipeline:
Why these key figures?
At Power Partners, we use these four key figures regularly. We talk about changing values, and we take the development of these KPIs as the basis for goal setting in our OKR sessions read more on goals and OKRs.
Why these four? Because they are the moste relelvant for Power Partners right now.
Financial reach
Power Partners is a young company. We are building a team of business intelligence specialists. This is time-consuming and expensive. Accordingly, everything can get out of hand quickly. It was important to me to have a single financial metric that works through various stages of maturity, while being relevant regardless of our strategy, the size of the team and the company structure. Most of our clients intuitively think profits could be such a KPI. At this stage, let me just assure you that profits is a bad KPI for this purpose.
Marketing Efficiency
We are working intensively on our marketing machine. Of course, there is a lot of detailed work behind it, and Jules spends hours analyzing and setting up Google Analytics. For me, this is too detailed in everyday life, so I was looking for a key figure that would summarize all these marketing experiments in one number, but which can then be broken down if necessary. And that's how I came up with Marketing Efficiency.
Project Efficiency
Project Efficiency is also just one of many possible and important key performance indicators from project controlling. At Power Partners, this was a latent problem in the beginning. We have always overestimating ourselves and underestimated the effort required to finish a project. So we started to track spent time more precisely.
Also, in terms of project efficiency, I can identify problems quickly, e.g. by breaking the value down by customer.
Months-in-Pipeline
Last but not least, the Months-in-Pipeline. Business Intelligence is complex. The analysis of data requires a lot of specialized know-how. Months pass before a junior employee is productive. So we can't just ramp up our capacity with every new project. Rather, we have to build up the capacity continuously while aligning our marketing and sales efforts with our capacity.
Every entrepreneur knows how difficult it is to find good employees and how much time it takes to build a good team. And it is clear to every entrepreneur that a company cannot grow at will if you want to keep the quality high while preserving the corporate culture. Accordingly, we have searching for a forward-looking measure that gives us clear signals for sales and customer communication. And with Months-in-Pipeline, we have found exactly such a measure.
How we apply these metrics
As explained above, we don't blindly apply these metrics to our decisions. Rather, we proceed as follows:
- We pay particular attention to changes in a value over time
- If a value has changed, then we ask ourselves why.
- Has anything happened inside or outside the company that explains the change?
- Was the change to be expected?
- Which component of the KPI has changed (i.e. which measure)?
- Is there a need for action?
- If we see a need for action, we consider:
- what are the consequences of the change?
- Are there any side effects?
- Who in the team will be affected by the change?
Are these key figures also something for my company?
We do not think that these four KPIs are the only necessary ones, or that they are universally applicable. A KPI is always closely linked to the critical success factors for a company. For this reason, we believe that a KPI is always very individual.
This may also explain why we do not see Power Partners as a software company, but rather as a consulting company that
- helps you to clearly formulate your business goals,
- then enable you to achieve those goals by designing relevant KPIs
- and finally ensures with emotional dashboards that the behavior of your team changes sustainably and in favor of your goals.
So, therefore also directly to the offer, which we have promised above:
A very special offer for you!
And, how do you like our KPIs? Is it all too easy? Do you have other favorite metrics, or do you prefer to stick to the good old gut decisions?
Or was it all too complicated?
Whatever your thoughts, into the comments with them! We are looking forward to a lively discussion!
What is the most important KPI for your company?
But what if you even get the idea that these key figures do not fit your company because everything is different for you?
You know what? You're probably right. Your company is just as unique as you are!
There's a reason why we don't just build an app with metrics for everyone. Again, consulting is an important part of our work. Yes, that's why every dashboard looks different.
Free, non-binding KPI consultation
Every company needs its own set of KPIs. To accommodate this, we have come up with a special offer for you. As a reader of the Dashboard of the Month, you can register below without obligation for a free KPI consultation. In a 30-minute video call, we explore which individually tailored KPI will benefit your company the most in the current situation. 20 years of experience in business intelligence and a database with hundreds of blueprints of KPIs ensure that you derive great value from this offer.
Your benefits
This offer is completely non-binding, and it is up to you what you do with the result. You are welcome to track the KPI manually in Excel.
Why do we do this? We are convinced that our KPI consulting will make you more successful. And if you are more successful and grow healthily, then the probability that we will soon count you among our customers increases. That's why.
Just try it out!
So, what are you waiting for? Grab a free appointment and, together with Christoph Glur, you will soon uncover the bottleneck, the biggest risk or the biggest growth opportunity of your company!


