We had to be patient for a long time. Due to Corona, The Finance Special Seminar of Unternehmercoach was postponed for half a year. In October finally about a hundred entrepreneurs gathered in Frankfurt, Germany to learn from six top-class speakers in various fields. The perfect occasion for Power Partners to revamp our Financial Reach dashboard that we published earlier this year. Don't forget to read on, because at the very bottom there is a link to the dashboard to play around with. And psst, there's a surprise too!
Description
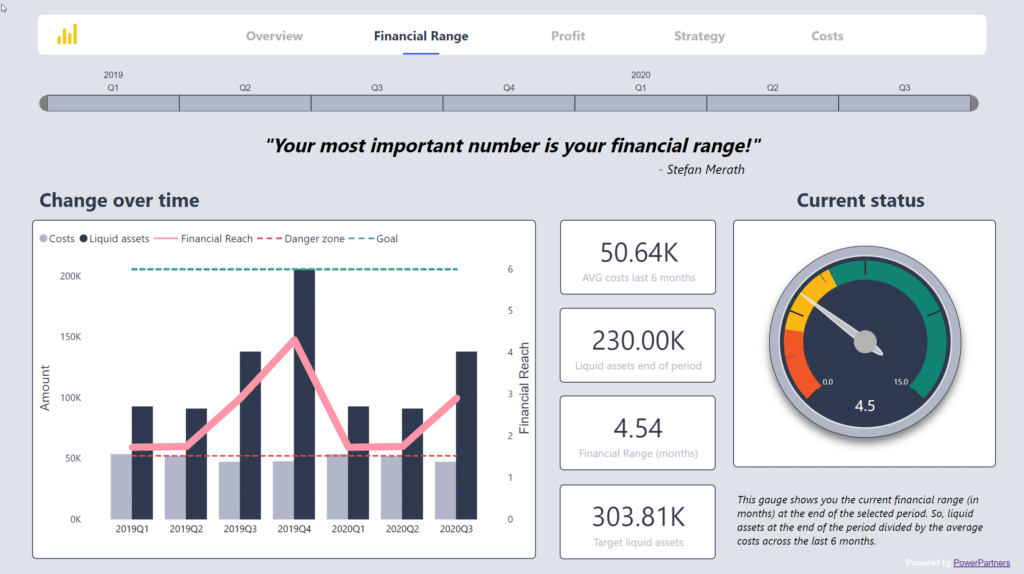
- Titel: Financial Reach
- Type: Educational dashboard
- Client: Give-Away for our beloved clients
- Budget: ca. 4 days
- Date sources: Excel (can also be connected to your ERP)
The Problem
We already knew that Stefan Merath considers the Financial Reach to be the most important indicator of all for smaller companies (read more). You simply sleep better when your company has sufficient liquidity.
But once again it was astonishing how many entrepreneurs do not (or do not want to) understand the concept of The Financial Reach. They think controlling is too boring. The product is much more exciting than cold financial figures. Time to face the truth...
Most entrepreneurs make the mistake of focusing solely on their product. Don't do that. Your banker is not interested in your product. He is interested in your finances, so you should too. Then your banker becomes your friend. And you will be fine.
Gerald Hörhan
Not yet subscribed?
Have you already subscribed to our monthly newsletter, Dashboard of the Month? Month after month, we present a dashboard and share insight on how our customers design smart KPIs, how they set their goals, and how they make sure they reach them by tracking progress in a Power BI dashboard. Not to miss!
The Solution: a Liquidity Dashboard
The dashboard allows you to keep track of your key liquidity indicators. Every month the new financial statements are uploaded in a SharePoint folder and updated automatically in the dashboard. This means all data is up to date and the reports are interactive. On top of that you can set an email alert on your key KPIs, so whenever a goal is reached, management receives an email update.
Our three greatest challenges. Firstly: numerical data awareness. Second: power games [e.g. between departments]. Third: the lack of good reports and visualisations.
Dr. Nicole Jekel
And that is precisely why we developed The Financial Reach dashboard: Firstly, to illustrate how simple the concept of the Financial Reach actually is. And secondly, to show what can be done with a Power BI Dashboard.
In essence The Financial Reach answers the question: if your revenue drops to 0 tomorrow, how long can your business survive?
Result
Over the past year we received a lot of interest for this and other liquidity dashboards. Would the Corona crisis have anything to do with that?
Sometimes one would think that there are more people making balance sheets, than people actually analyzing them.
Christoph Glur
Financial statements are for a lot of companies still an untapped source of valuable information. Insights in these 'cold' numbers will allow you as a business owner to proactively plan for your future.
This dashboard can help you get on the right track.
Test the dashboard yourself


