Maxime Pinsart is a jack-of-all-trades in the world of digital media. Videography, photography, web design and graphic design are all part of his domain. He has been in charge of the Marketing and Communications of real estate agency Found and Baker for 2 years, they are now pulling the map for a data-driven future. Read here how they monitor and improve their multi-channel marketing activities using a Power BI dashboard.
Description
- Titel: Digital Marketing
- Type: Management dashboard
- Client: Found and Baker in collaboration with Maxime Pinsart
- Budget: 3 days
- Date sources: Google Analytics, Facebook Graph API
Need for more insight
With his own Digital Media agency, Maxime Pinsart works on numerous ongoing projects. A trend he has noticed for many of his clients for some time now is the demand for more insight into the results, a demand for more data.
"I have been responsible for the Marketing and Communication of real estate agency Found and Baker for 2 years now. As an agency we are very proud of the properties we are allowed to sell for our clients. Often we also have a lot of beautiful pictures at our disposal. It is my job to reach as many potential buyers as possible, especially digital ones".
In consultation with their Founding fathers, David Fonteyne and Philippe De Backer, they developed a strategy to significantly increase the reach of their listings.
As an agency we are very proud of the properties we are allowed to sell for our clients. It is my job to reach as many potential buyers as possible.
Maxime Pinsart
The Found and Baker website is an important source of information. "Via Google Analytics, we already got our first insight into this. The big problem is the abundance of information over 1000 data points in such a way that you can no longer see the bigger picture". Until recently they did a monthly analysis in Excel about the (new) visitors.
Not yet subscribed?
Have you already subscribed to our monthly newsletter, Dashboard of the Month? Month after month, we present a dashboard and share insight on how our customers design smart KPIs, how they set their goals, and how they make sure they reach them by tracking progress in a Power BI dashboard. Not to miss!
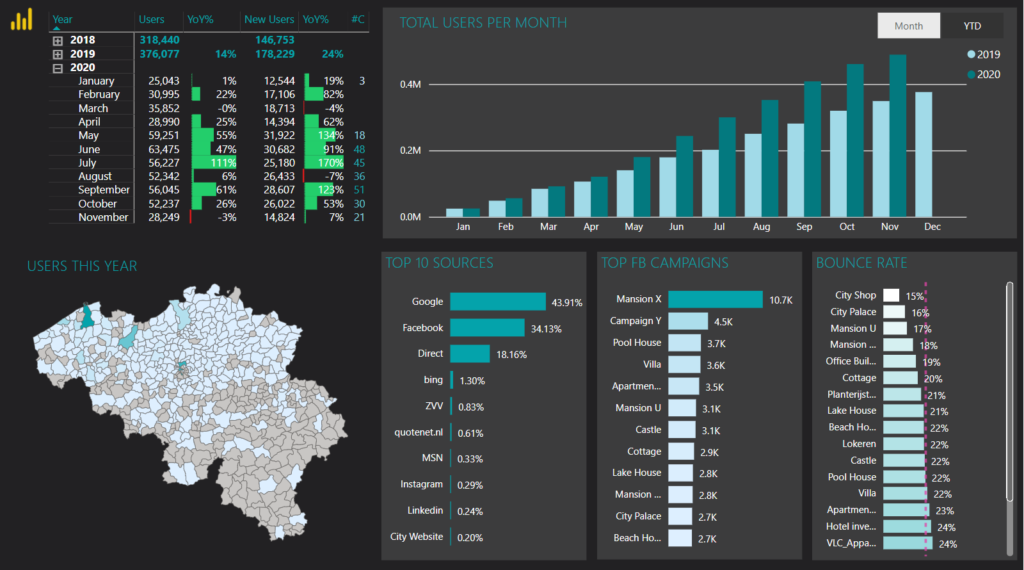
Dashboard
The familiar Excel table can also be found in the dashboard. However, it is now automatically updated and works as a filter on the rest of the dashboard. The user can easily select 1 or more months to analyze it in detail.
But there is more, since the beginning of this summer they have been using google campaigns every time they announce a new property via their Facebook page. This allows us to get more insight into the interactions, bounce rate, profile/behaviour of the visitors on our website.
It will be very interesting to follow up our presence in and around Ghent in the coming months.
Maxime Pinsart
Found and Baker is an ambitious and growing office, to meet demand they recently opened a new department in Sint-Martens Latem. The dashboard contains a map with colour saturation to users per city. "It will be very interesting to follow up our presence in and around Ghent in the coming months."
"We are convinced that we still have great growth potential here and this dashboard will help us not to lose sight of the goal".
Finally, there is also a detailed overview of the Facebook page, for this click on the logo at the top left. Insight about the impressions, likes, profile, posts, budgets…
Result
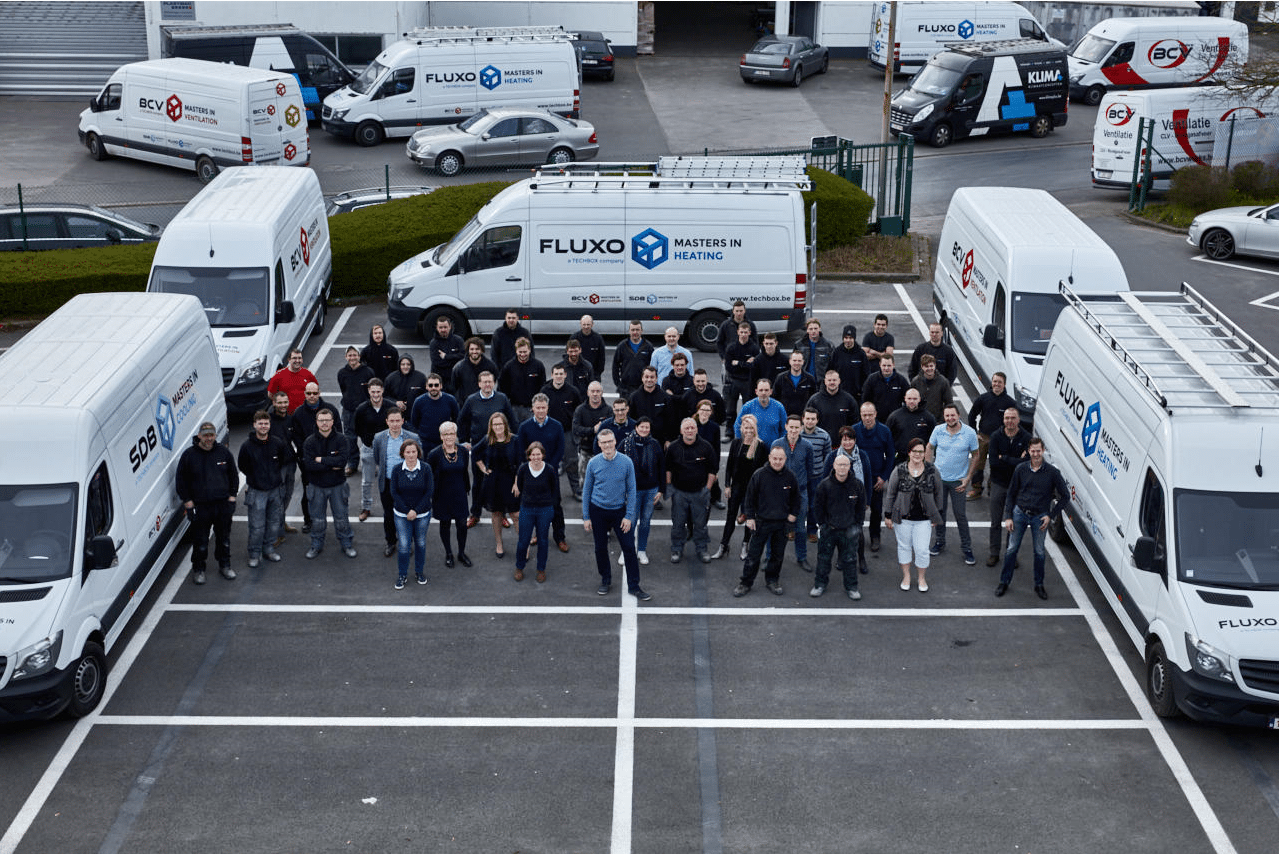
Over the past year, we have done a lot to increase our reach both digitally and through traditional channels. And frankly, after all this effort, it feels great to be able to present hard figures on our growth together with the whole team!
Via Facebook we now reach around 500,000 people every month, many of them also click through to our website. This is proof that our multi-channel marketing campaign is bearing fruit.
Maxime Pinsart
"The simplicity of the Power BI dashboards appeals to me. I just have to log on to the platform and I can always see all my data up to date. We can also tell you that we are working on a new Business Intelligence project specifically for our clients, more on this later!"
Try yourself!
Of course this is about a version with fictitious data, but everything is interactive, have fun!


