Both Excel and Power BI were developed by Microsoft, one was already there in 1985, then still on the Apple Macintosh. The program with the green logo has already had several transformations, but is now fully ingrained in our company culture. Excel will not disappear. What will disappear - in our opinion - is the cobbled together reports in Excel. Simply because there are much better options on the market. One of them is Power BI in this article everything you need to know.
Excel the pivot in our business reporting
No doubt you and your employees have already been struggling in Excel files. Excel is very suitable for quick (financial and numerical) analyses and forecasts. Over the past 35 years, the program has played a prominent role in the business reporting, both ad-hoc reports as well as regular – say monthly, management reporting.
Yes, Excel is perfect for playing with data and juggling with numbers. You can easily set parameters, adjust them according to the situation, and play through scenarios. That’s more arguments than we would need to confidently say that Excel is here to stay.

Excel Frustrations
Lack of clarity
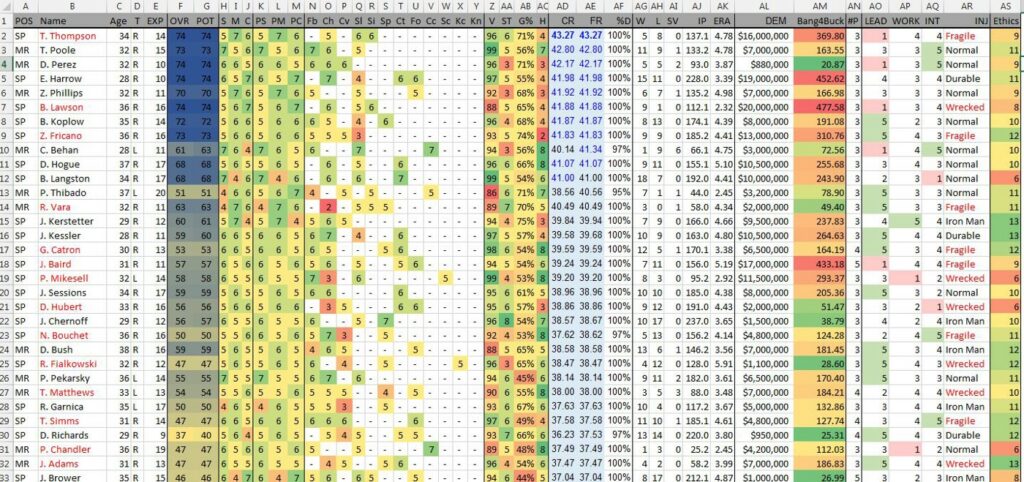
In general, you could say that Excel's biggest problem lies in its strength: its flexibility and its one-fits-all design. As soon as your company is large enough to have several business units, you have data all over: years, managers, different versions of the same report. If you are lucky (and disciplined), you quickly end up with a large spreadsheet with pivot tables.
If you are anything like the average company, you (or your CFO and/or COO) ends up managing hundreds of worksheets. Most of these sheets will be cluttered with numbers and cells you hardly ever look at. How to navigate in such a spreadsheet? Where should the user start? How to spot errors? You don't even look at 99% of these cells.
How do you notice that the sales for one of your customers in the month of October of this year are 10% lower compared to the same period last year, and this while he started to order more in the past 4 years?
Simple. You don't notice this.
You probably take a quick look at the first 2 sheets, look at some aggregated figures and draw your conclusions from them. But how do you notice that the sales for a specific customer in the month of October of this year are 10% lower compared to the same period last year, and this while he started to order more in the past 4 years? The answer is simple, you don't. You simply will not notice outliers, anomalies or trends. Spotting trends in Excel tables in time is extremely unclear and one of the biggest problems.
Waste of time
As a manager, you may have the luxury of having such Excel spreadsheets prepared for you. Your intimidated staff spends hours preparing them and dropping them in your mailbox. But guess what? Just because somebody else is doing the dirty work doesn’t mean that the overall process is efficient.
I still remember that I did an internship within a nice SME in Flanders. Every Friday I spent 4 hours preparing a cash flow report in Excel for management.
Jules Vandierendonck - Power Partners
In our experience from our work with our clients, about 90% of the time is spent on creating and maintaining the spreadsheets, while only 10% is used for analyzing and interpreting the data. Go figure. You're a manager – and therefore responsible for steering your team in the right direction – yet you only spend a fraction of your time interpreting the data? Oops, not really manager after all.
Sharing reports
Picture this: You have spent hours and hours on your Excel workbook. You know every formula in this spreadsheet. You are literally dreaming of cells and you start every sentence with equals. Yes, you can be proud. And you are! Your sheet is a true work of art. A Magritte, maybe, or even a Van Gogh? You proudly ask your colleagues. But to them, it’s more of a Jackson Pollock: also expensive, also beautiful in its own way, but a bit chaotic and not to everybody’s taste.

And we’re not just talking visuals. The "data model" and the transformations are all but robust. Adding another dimension quickly becomes a weekend project. Indeed: low maintainability, labor-intensive, and very expensive. Sunk costs.
Outgrowing Excel, Power BI as an alternative?

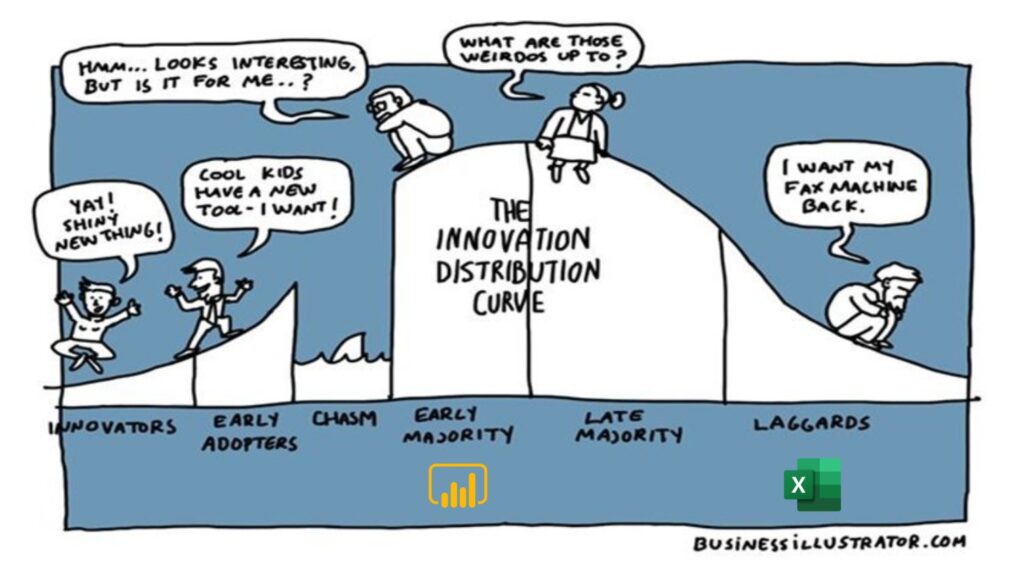
Early majority
We started this article by emphasizing how important Excel has been for many years. And is! Even we at Power Partners still regularly use Excel for quick ad hoc analyses. However, since the launch of Excel in 1985, IT has advanced with giant steps. One could argue that the use of Excel as a pure input and reporting tool is in the laggards phase of the innovation curve (see graph above).
Today, there are still companies that set up their full reporting in Excel, but they are threatened with extinction. They are also sometimes called the "technology dinosaurs ". A playful term for managers who refuse to include new technological alternatives in their daily management.
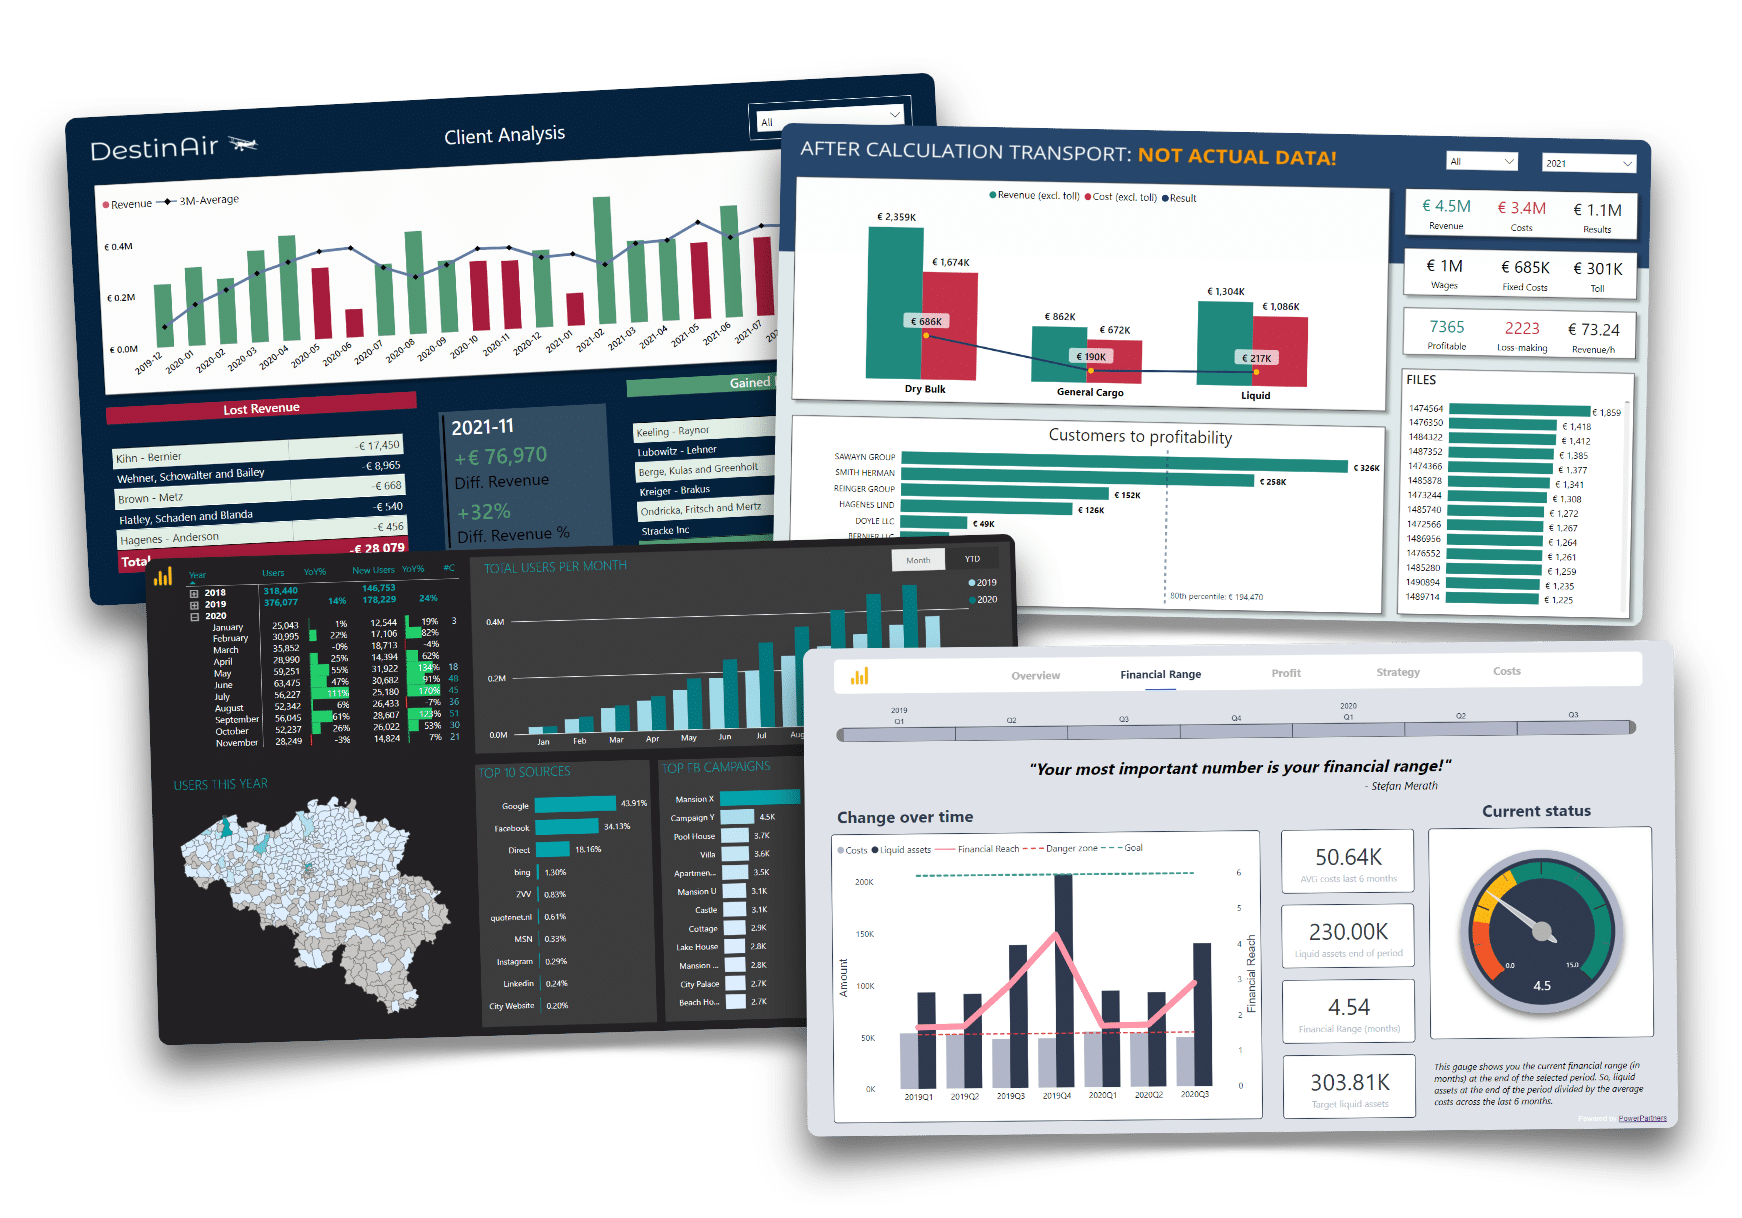
Looking for the contemporary version of Excel? Please welcome BI, Power BI!

Power BI is one of the alternatives for more powerful interactive reporting. Before the launch of Power BI, business intelligence was exclusive to large enterprises with high budgets. But that changed in 2015, Microsoft carved out Power BI from Excel and introduced a stand-alone Business Intelligence tool to the general public. Henceforth, anyone could use a powerful business intelligence platform, for a fraction of the cost of the incumbents.
| Power BI | Excel | |
| Launch | 2015 | 1985 |
| Cost per user/month | €8.4 | €7 |
| Flexibility | ✅ | ✅ |
| Interactivity | ✅ | ❌ |
| Easy visualisation | ✅ | ✅ (we prefer Power BI) |
| Secure report sharing | ✅ | Only via the file system (or OneDrive or similar) |
| Unlimited data sources | ✅ | Only manual |
| Built-in data protection | ✅ | ❌ |
| Live data streaming | ✅ | Not out of the box |
| Multi-dimensional datamodel | ✅ | ❌ |
Power BI isn't just a little more beautiful and a little more visual. No, it's much more than that, it's a complete business intelligence cloud solution that allows you as a company to set up a data culture. Building interactive reports and sharing them securely with your team has never been easier and more affordable.
During the period 2018 - 2021, Power BI saw a new influx of users. Managers of small and medium-sized enterprises started using the Power BI platform. These managers prepare their team/company for a data-driven future. They hope to gain a competitive advantage in their sector in the next 2-5 years. Business intelligence is starting to trickle down to the core of our economy.

Today we are in the "early majority" phase of the Power BI innovation curve. The Power BI platform has been available for 7 years and is maintained by more than 1000 Microsoft developers who come up with improvements every month. If you start with Power BI today, you are no longer super new. Yet you are more than welcome, together with millions of other users you can now acquire more insights from your data!
Do you have questions about Power BI and the data within your company? Book a free video call with one of our consultants.
An offer for you!
Let's talk about Power BI, data and reporting in your business. In a video call we will see if Power Partners can help make your company more data-driven. Completely non-committal and confidential.


