Vensol is a family business with more than 15 years of experience in the realisation of electrotechnical projects, including industrial lighting projects from A to Z. Kris Decraene and Inge founded the company and still work as senior partners in the business. Their son Thomas is now the second-generation managing director and project manager. It was Thomas who recognised the need for better cash flow and project reporting and approached Power Partners.
- Title: Optimising cash flow and project management at an industrial power company.
- Budget: 12 days
- Data sources: Visma Bouwsoft, Sage BOB and Excel
Vensol
Thomas Decraene is the second-generation managing director at Vensol. He places great emphasis on optimising business processes. This is a theme we often see with our clients. The new generation of managing directors in family businesses come to us with an innovative and ambitious vision for the company. They want to respond to the latest trends and, above all, secure the future of the business. Managing directors like Thomas then often opt for modern Microsoft technologies such as Power BI and Azure.
As a trained project manager/manager in 2022, Thomas has developed the ambition to gain more insights from operational and financial data of his business. A year later, the business is unrecognisable.


Challenge
The team at Vensol has been familiar for years with Bouwsoft, a specialised ERP system designed specifically for construction companies working on a project basis. The ERP system is not unknown to us; we have already implemented a project on Bouwsoft at Techbox . Bouwsoft plays a central role in Vensol's daily processes and contains a lot of valuable operational data. BOBSage is also used for accounting.
Bouwsoft supports Vensol well in its daily processes. But a manager wants more than just an operational ERP system. As a (project) manager, you want to have a timely and regular overview of your company. It is simply impossible to constantly search for the current status of more than 40 ongoing projects . Budgets, positions, hours, equipment, invoices, etc. It feels like looking for a needle in a haystack. Opportunities are missed. Problems are identified too late. And then in the post-calculation at the end of the project, you are presented with a fait accompli.
This is not enough for Vensol, they want to proactively identify opportunities and problems in their projects and react to them. That's why they switched to an automated project management dashboard in Power BI.
Solution
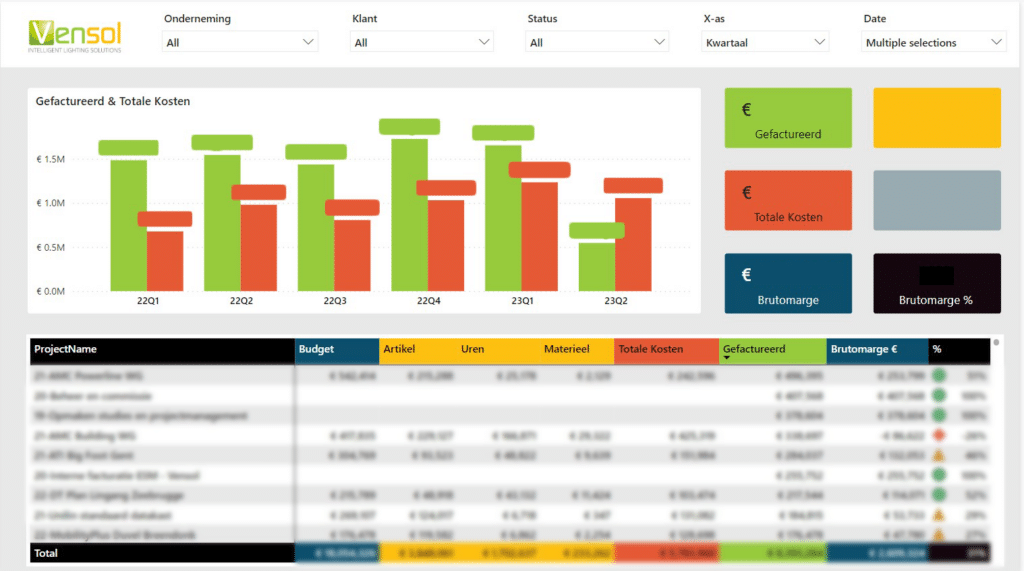
A Power BI dashboard shows the three main cost drivers from the ERP system: items, hours and material. These are combined to show the total costs (red), which are then compared to the project budget (blue). Using this dashboard, the Vensol team can immediately see which costs are logical and which costs are disproportionate to the project competency. After the monthly invoicing, they can also see the actual amounts invo iced (green).
At the top of the dashboard there are special filters that allow them to view data by company, client, status, period and date. This gives them a detailed overview of the relevant information they need. The dashboard provides a quick and efficient way to analyse data and gain insights.
The dashboard's overview view allows you to see a wide range of information at a glance, as opposed to the time-consuming task of looking up data in their ERP system or exporting it manually. This makes a big difference in terms of time and effort.
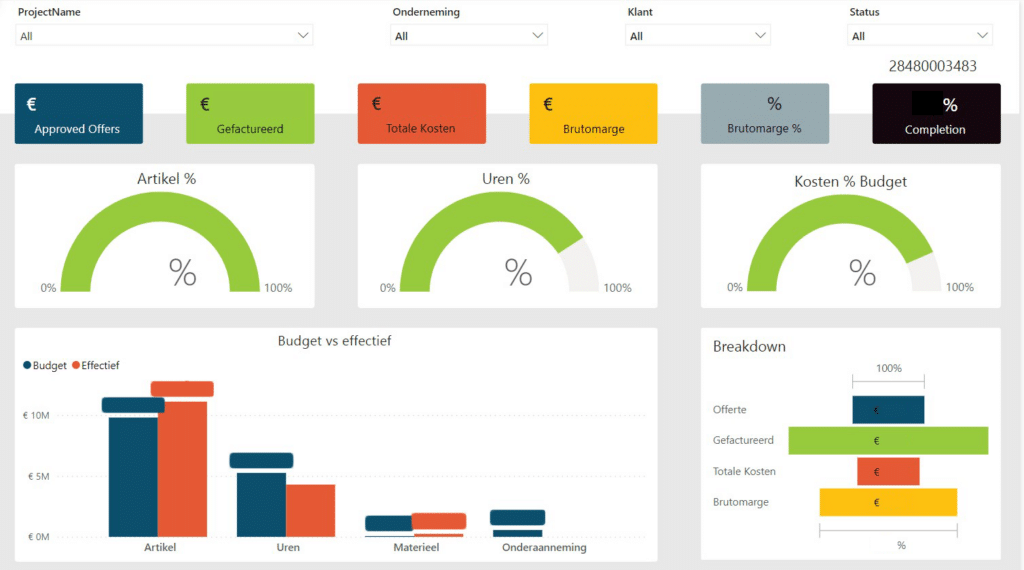
In addition to the "Overview" dashboard, there is also a "Detailed View" dashboard. The analysis starts on the overview dashboard. When a project catches our eye, we look at it in detail.
What all can we see per project:
- The accepted amount of the offer
- The invoiced amount
- The total cost
- The gross profit margin in percent and euros
- The progress in percent
- The percentage of costs allocated to items
- The percentage of costs allocated to labour hours
- The percentage of costs compared to the budget
In addition, we can also see the budgeted and actual costs per cost item, namely
- Costs for articles
- Cost of labour hours
- Costs for equipment
- Subcontracting costs
Data culture
Vensol started using Power BI through a kick-off consulting day from Power Partners. The company is now already in the next phase: the transition to a lived data culture. In addition to Thomas, another employee is now attending Power BI training to increase the use of Power BI in the company. They are on the right track and intend to create their own reports based on their existing DataWarehouse soon. It is important that not only management but also other key staff use the dashboards.
Would you like to learn more about the 7 steps to a data culture in your company?
In a nutshell
Large amount of data:
Vensol works with a large amount of data. For example, they have BOBSage for all financial data, Visma Bouwsoft for project management and Excel for budgets.
Complexity of projects:
There are many facets they have to consider, such as planning, budgeting, project progress and cost control.
Strict budgets and deadlines:
Vensol has precise budgeting and cost control to complete projects on time and within budget.
Quick decision making:
With Power BI, Thomas and other project managers can analyse their data and make decisions based on actual data, not assumptions.
Collaboration between departments:
Close collaboration between different departments, e.g. engineering, project management and finance.


