
Google Analytics is a web analysis service from Google that tracks and reports website traffic. It is by far the most popular tool within marketing teams to get insights into their website data and their online users. Google Analytics is great and we also use it weekly to make adjustments to our website. But there is an option to get much more out of your website data. You can relate the Google Analytics insights to other business data. How? Well that's easy with Power BI!
Multi-channel marketing
A visit to your website is often an important step for a potential customer. On your website you give more information about your company as well as the services and products you offer. Many roads lead to your website. Google, Instagram, Facebook ads, newsletter... A good marketing team will always use multiple channels to attract new leads to your website. This is what is called a "multi-channel approach".
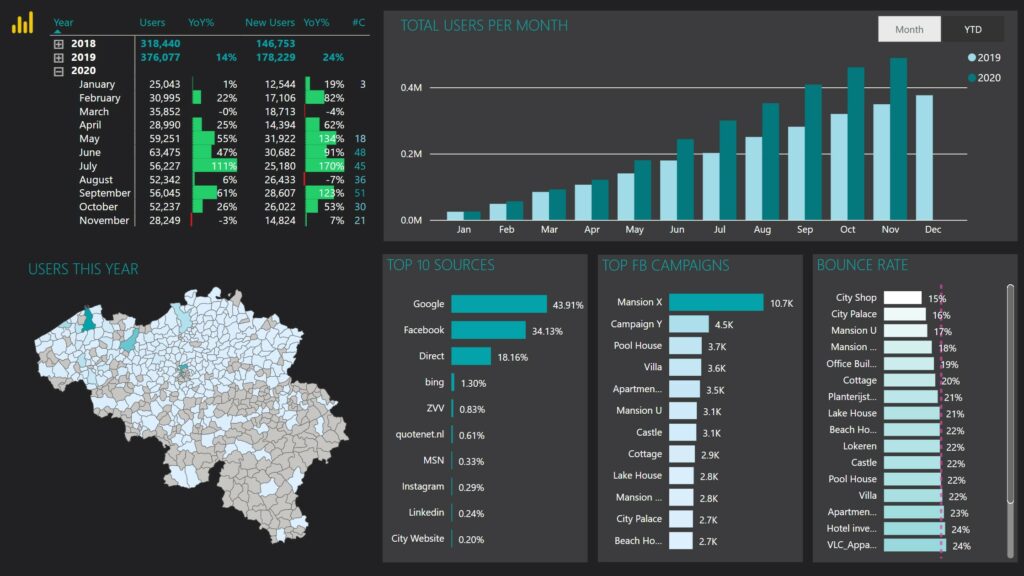
Google Analytics can sometimes feel overwhelming, it stores 100's of data points.
Jules Vandierendonck - Power Partners
When these visitors end up on your website, all kinds of data is registered. Source, sessions, bounce, duration, language, location, gender age, behavior, device, IP and hundreds of other data points.
A frustration that often occurs when using Google Analytics is the overload of information. But how do you look for the data you need? Do you even know what you're looking for? Multi-channel approach, remember? So your marketing team uses multiple channels to attract leads to your website? Interesting! Well, which channel works best? That's a good starting point, let's start our analysis with this.

Power BI Connector
We want to relate data from our website visitors (Google Analytics) to our Google, Facebook and Instagram campaigns. In the future, maybe also with data from TikTok, Mailchimp, Hubspot, Salesforce... but today we start with these three. That's where a lot of advertising budget goes every month. So it's time to compare them in detail. Okay, nice! But of course we first need data for that.
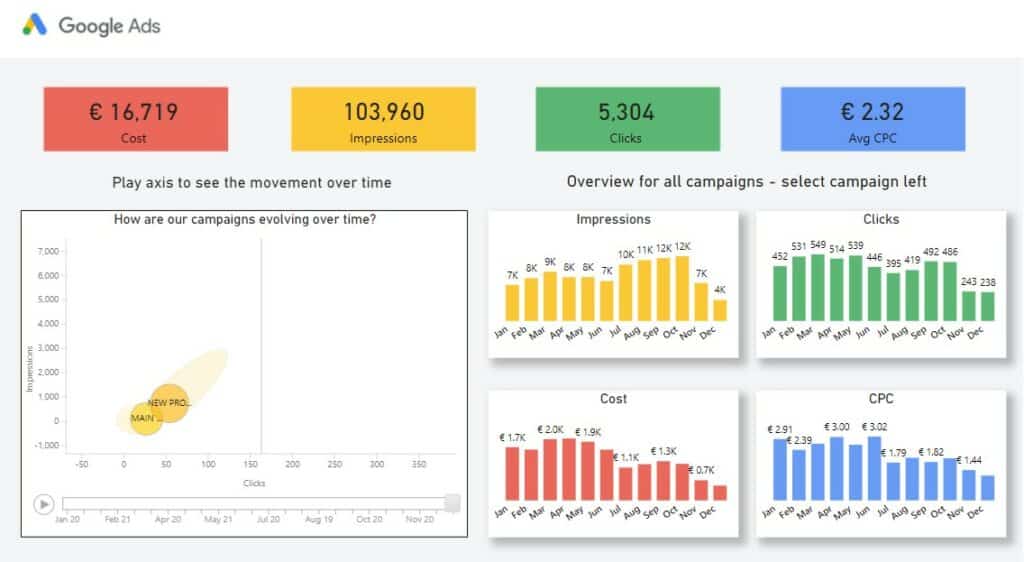
A connection between Google Analytics and Google Ads is simple, both are part of the same platform. You can set up a connection in Google Analytics and compare the data of your Google Ads campaigns. Okay, nice, then we already have that.
But the next step is a bit more difficult, how can we also compare the data from Facebook and Instagram in Google Analytics (GA)? There is no integration for this. So we will have to find another solution. Excel then? Working on a spreadsheet for a few hours every month and then presenting it weeks after the campaigns in a meeting where only sleepy colleagues are sitting?
No, that's a thing of the past!
But how do you evaluate all this effort?
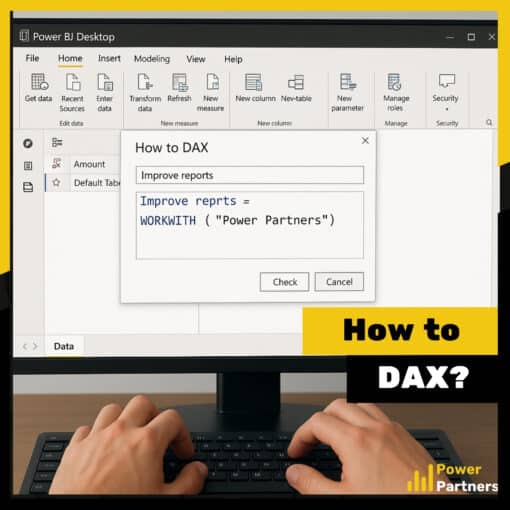
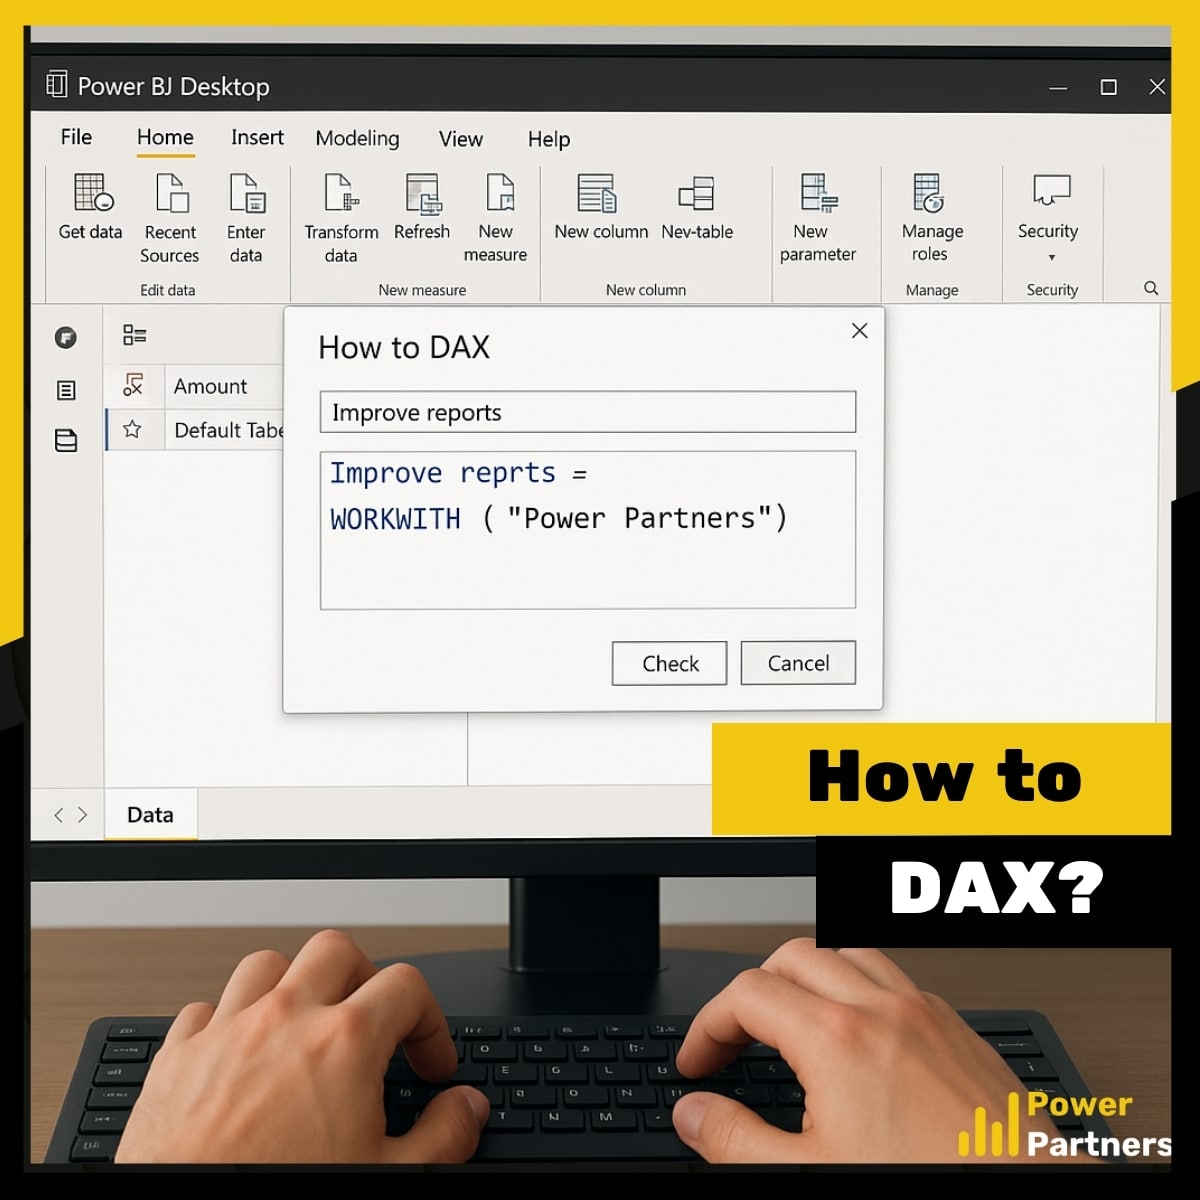
Simple! With a Power BI marketing dashboard of course.
But how do I get started?
You'd better start and set up your analysis right away in Power BI. Even if you only want to analyze GA data today, it is better to start directly in Power BI. You can always add data from other systems to your data model later on. You can always save and further develop your dashboard and data model.
Don't have Power BI desktop installed yet? It's completely free!
Get your data from GA and easily pull it into Power BI? You can do that with the free connector, see this video.
Is your dream dashboard already built? No? Well then this example might help you get inspiration.
An example
You are a marketing manager of a B2C company. Together with your team, you are responsible for bringing as many people as possible into contact with your products online. Part of your tasks consists of launching a Facebook and Instagram campaign 1 time a week. You notice that certain campaigns score better than others, "you just feel it".
However, you use ever-changing budgets for the campaigns. The prices of the products you sell also vary between 50 and 1750 €. Nevertheless, as a team you want a clear balance between the channels, campaigns and products. Ideally, you want a dashboard where each team member can easily find the necessary information.
But there is more
What about products for which several campaigns were set up throughout the year?
How do we evaluate the campaigns if they have different target groups?
As you can see, we have many variables for the campaigns:
- channel
- product
- target audience
- region
- time of the campaign
- budget
- ...
We need a simple KPI!
For B2B company without webshop
Return of the resources deployed = Campaign budget / visitors to website (GA)
Since we do not have a webshop, this will rather be an indirect indication of the sales. The results of the KPI could then look like this.
- Facebook: € 25 per 100 clicks to website
- Instagram: € 18 per 100 clicks to website
The evolution of these KPIs could then be compared over time. But there is more, you could start filtering by:
- product (or product group)
- target audience
- weekday/weekend
- region
-> Our dashboard now shows that we can optimize the sale of washing machines by focusing more on Facebook campaigns and this best between 9-12 o'clock on a weekday.
-> It also turned out that the sale of premium laptops increases when we plan Instagram campaigns between 18-22h in urban regions.
For B2C companies with webshop
Next step would be to set up conversions in Google Analytics. Every time there is a purchase on your website, the conversion and the amount of the purchase comes through in GA.
Return of the resources deployed = Campaign budget / purchase on website (conversion in Google Analytics)
- Facebook: €1 in ads delivers €1.35 sales
- Instagram: €1 in ads deliver €1.75 sales
If we put a reference to the type of product in the campaign, we can examine all these KPIs per product. But we can also filter the KPI per:
- region
- age
- gender
- ...
-> Our dashboard now shows that we need to scale back the ads for headphones on Facebook and use this budget for Instagram ads for adolescents in the Brussels region. The KPI for this product in this region is 1.9
For every euro in ads, you'll receive €1.9 in new sales! A money machine?!
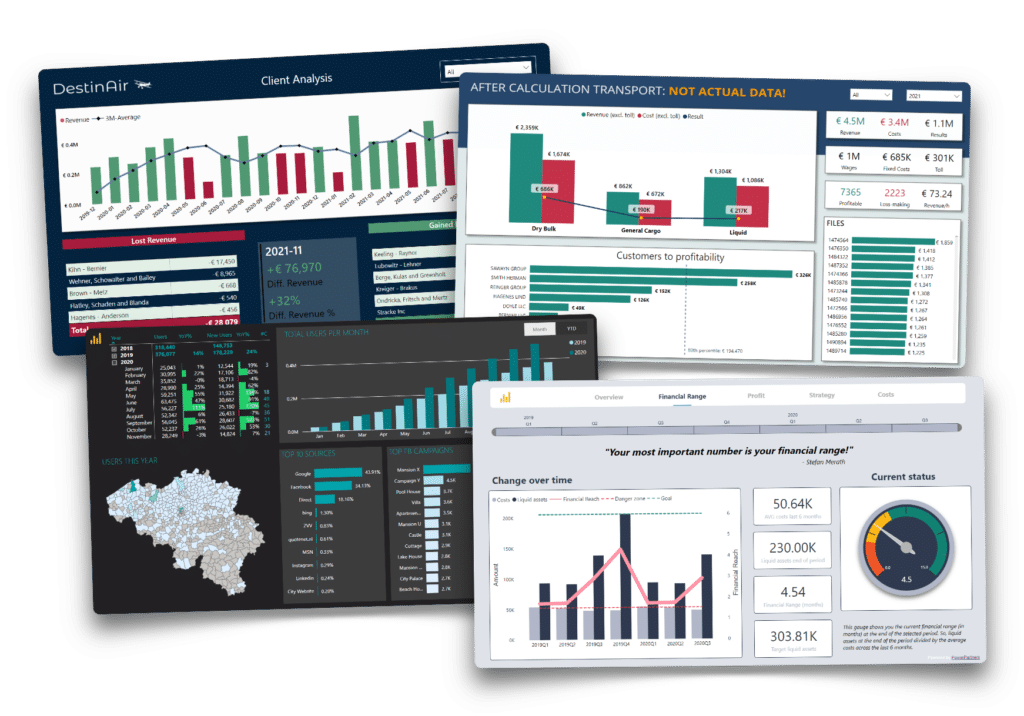
Download our
dashboard portfolio.
Learn how BI can help your company.
✔ Management dashboards
✔ Financial KPIs
✔ Power BI examples
✔ Free advice

