
January is traditionally the month for SMEs to take a break and look back on the financial results of the past year. It is no coincidence that we are launching our brand new Finance Reporting Accelerator this month. It is the result of a close collaboration with our new partner Sonical. In recent years, the group of IT experts has grown into a quality label in the form of a scale-up with more than 430 customers. Due to the growing demand for Power BI within Flemish SMEs, Sonical is now expanding their offer in the form of a collaboration with Power Partners. Through this story, we launch the series of 6 financial dashboards developed by and for CEOs & CFOs.
- Title: Finance Reporting Accelerator
- Budget: from €9.990
- Data sources: Business Central, Azure Data Factory & Excel
- References: Duco, Bluedrops, beMatrix

Start with the financials
Dashboards and reporting come in all shapes and sizes. Every company is different and so is often the reporting need. In recent years we have seen many different dashboards pass by, some of which can be found on our reference page. Yet you notice that companies often start their Power BI story by automating their financial reporting.
In the first place because this data is often easily accessible within a company. Automating financial reporting is often also where the progression in time efficiency is greatest. As a result, these Power BI projects are generally repaid within 18 months.
Furthermore, it is of course the case that important financial indicators are central to the management of a company. In Belgium, where a lot of our clients have offices, many of these figures are also made public and viewed by your bankers, customers, suppliers, future employees, etc. As a management team, you want to monitor and adjust these KPIs at all times.
New to Power BI? Probably the first application lies within your financial reporting.
Jules Vandierendonck - Power Partners
We think it is important to emphasize that this will be an "ongoing process" of continuous improvement. It is unrealistic to expect that the transition to a data culture within your company will be a process of only a few months.
You will learn to use Power BI, share it with your team, collect feedback and then adjust again. With the Finance Reporting Accelerator you lay a solid foundation in a few weeks on which you can continue to build for years to come, also for other business units (think of sales, purchasing, operations, etc.)
For the educive reader, we list the 5 most important benefits of Power BI reporting.
- Time saving: no more manual collection and manipulation of your data.
- Improved accuracy: no more room for human error.
- Easier analysis: An automatically updated dashboard makes it easier to gain insights.
- More focus on decision making.
- Increased staff engagement: by making things visible, you can start to develop a data culture.
With the Finance Reporting Accelerator you are up and running in a matter of weeks.
Olivier Laloo - Sonical
Automate vs. standardize
Power BI can use automation to collect and process data for use in dashboards. This means Power BI automatically performs tasks that would otherwise be done manually by you or your team.
While standardization can be used to ensure dashboards are consistent and meet certain specifications. This ensures that you and your team are always talking about the same analyses and avoid everyone making their own interpretations.
Microsoft Integration
As a manager within an SME, it is your job to facilitate your people in efficient work. The right tools are important here. Even more important is the integration of all these tools. If each software program is used separately from each other, sooner or later your team will get into trouble with frustrations as a result.
Your team already uses a range of Microsoft solutions, Power BI fits in seamlessly with this eco-system.
Kris D'Hoest - Sonical
Excel workbooks can be linked to Power BI dashboards to refresh data automatically.
PowerPoint can be used to present Power BI data in professional-looking presentations. You can process live data in the slides, even the dashboards are interactive! You can learn more about this in this video.
Business Central is a Cloud-based ERP system used to manage and automate business processes. Data from Business Central can be imported to Power BI for analysis and visualization.


The Implementation
The Finance Reporting Accelerator comes with a strong standardized foundation. Nevertheless, the package also comes with sufficient budget to configure parameters tailored to your company.
- P/L structure
The specific items on a profit and loss account may vary from company to company depending on the nature of the company and the type of products or services it offers. So we have to map these out. From your ERP system, we define how your financial data is organized. We then ensure that your trusted financial reporting structure can be found in the dashboards.
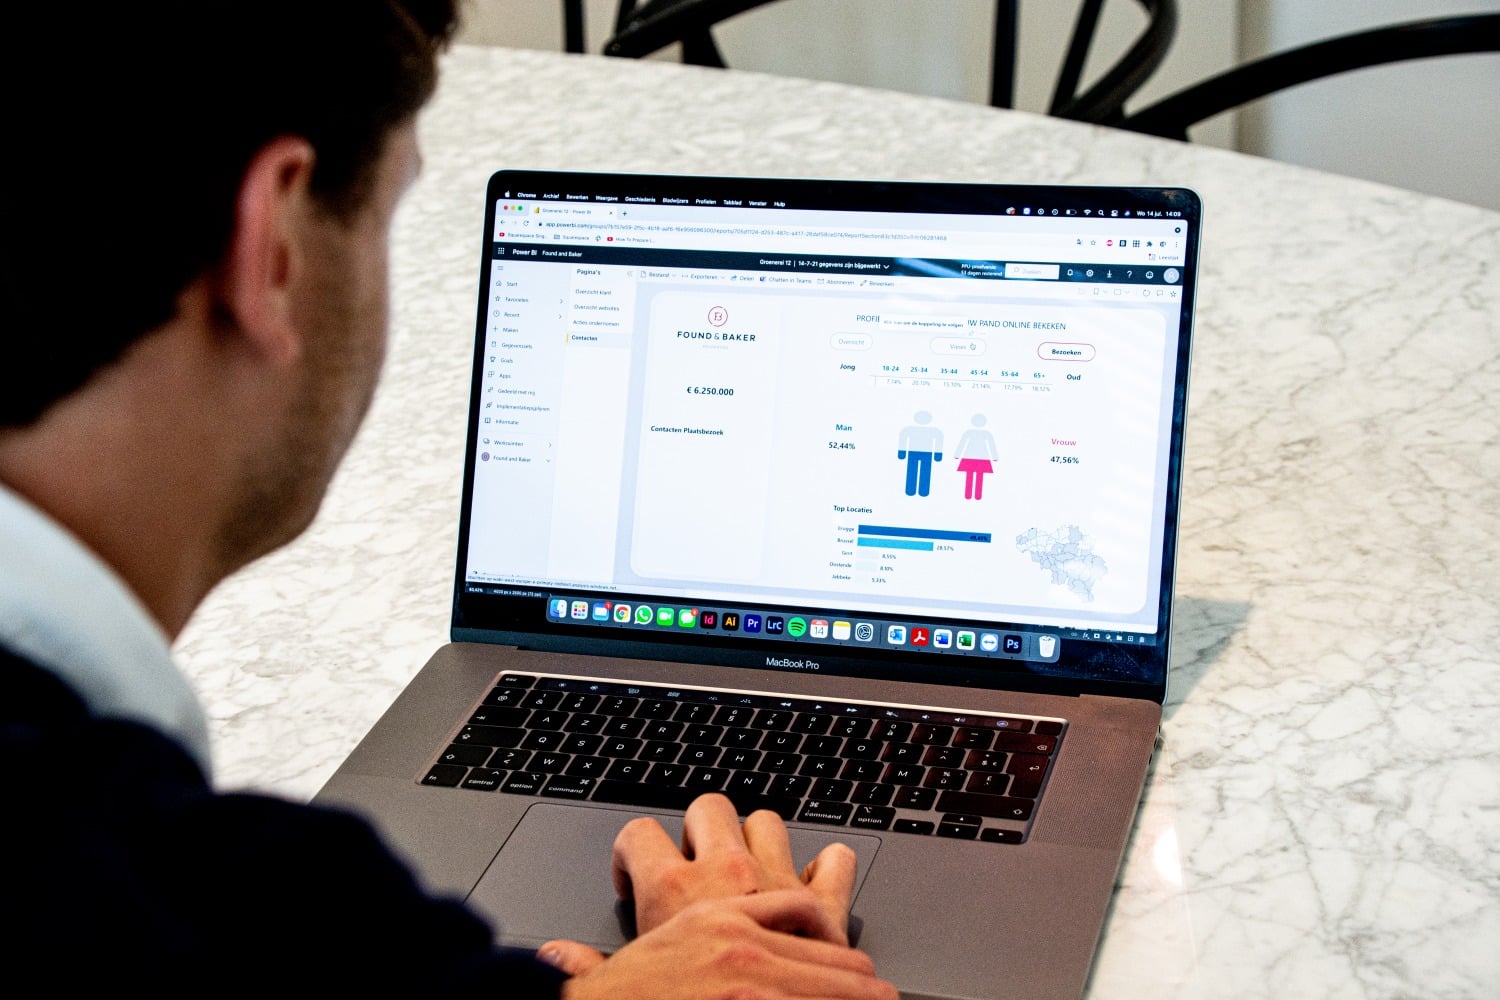
- Corporate identity
Adding branding to Power BI reports based on terminology and company colors can make them more intuitive and familiar to staff, helping them better understand the data.
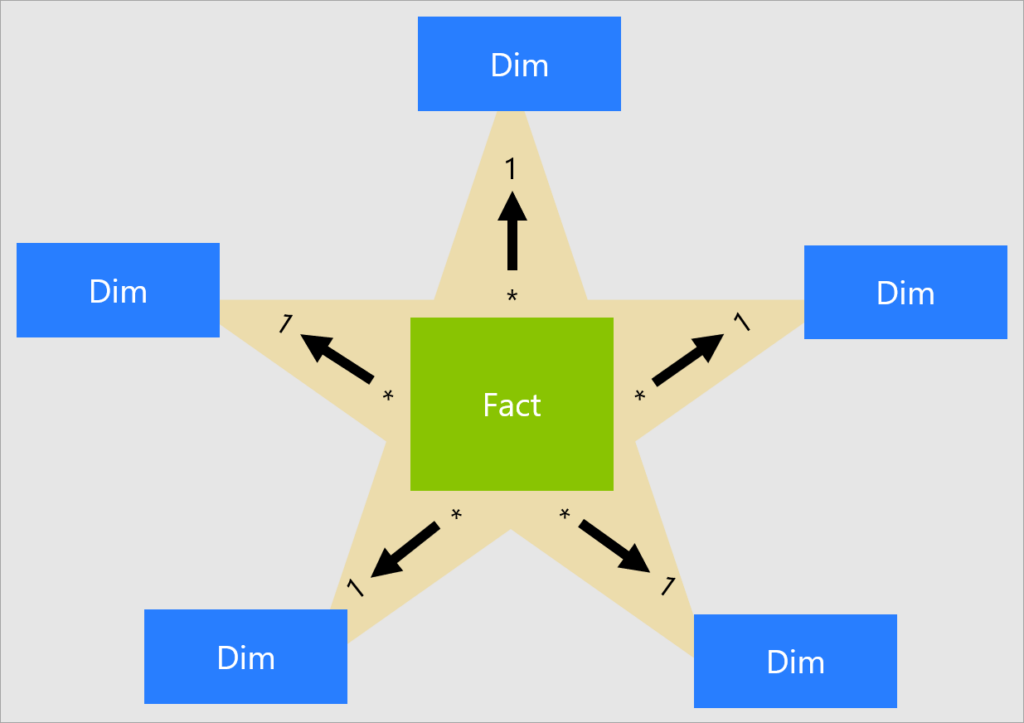
- Future-Proof data model
The reports are built on a future-proof data model. It was specially designed to remain flexible and scalable. In this way, we respond to changing business needs. Flexibility for adding new data sources or dimensions is of great importance.
Characterize:
- Scalable
- Flexible
- Clear
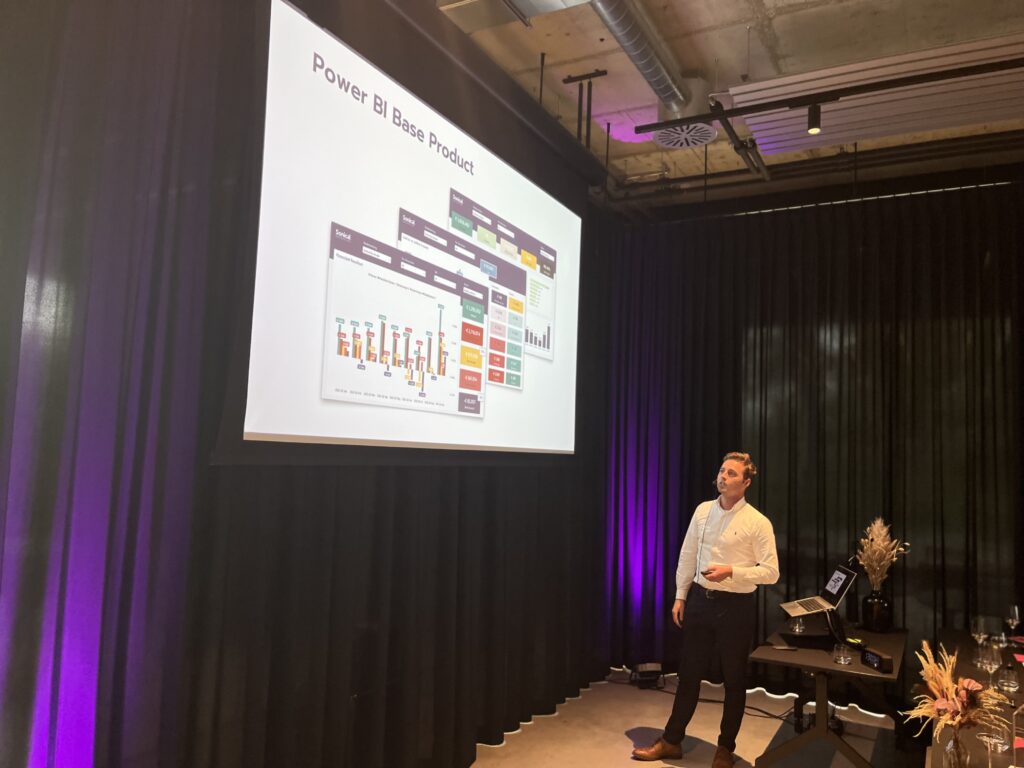
The dashboards
Each dashboard peals back a new layer of detail, until you get to the core of the problem. During your monthly consultation of the dashboards, you always know where to look first. Sometimes the overview is enough. Other times, certain KPIs require a little more analysis in detail. Every month, you and your team get better at analyzing the numbers.
The goal should be to have gained enough insights in just 60 minutes per month to make adjustments and start the new month.
Wout Timmerman - Power Partners
We already gave you a first insight into the reports, data sources and budget. The package consists of a total of 6 dashboards.
| Dashboard ✅ | Charts 📊 |
|---|---|
| Financial Overview | Key KPIs, Gross margins, Net margins |
| Financial Trend | MoM%, QoQ%, YoY%, |
| Cash forecast, AR/AP | Overdue payments, Cash |
| Sales | By Customer/Account Manager/Product |
| P&L | Daily update |
| Balance Sheet | Daily update |
An offer for you!
Let's talk about Power BI, data and reporting in your business. In a video call we will see if Power Partners can help make your company more data-driven. Completely non-committal and confidential.


